
Log Into the User Interface
When you launch your browser and enter the web address provided by your administrator, you will see a login prompt. For more information on accessing your environment from a web browser, see Access and Use Self-Service Analytics. Your administrator’s instructions provide guidance about using a single sign-on system if your organization’s installation is configured to use one. In that case, select the appropriate log in prompt and proceed as directed by your organization’s guidance. If your company uses Self-Service Analytics’s authentication, select the box labeled Show Self-Service Analytics Authentication.Sign On Using Self-Service Analytics Credentials
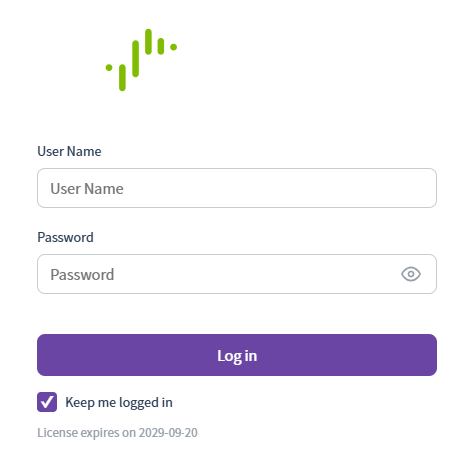
To sign on using Self-Service Analytics credentials, enter your User Name and Password in the appropriate fields. Enable the Keep me logged in checkbox, if needed.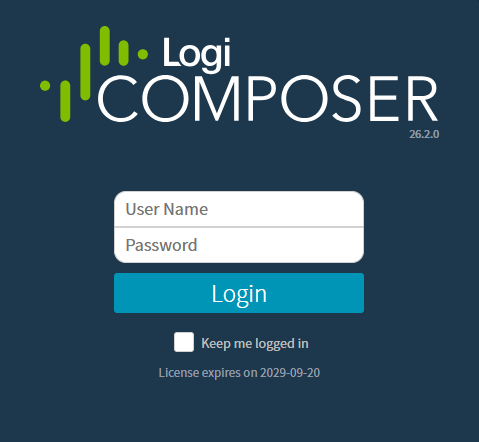
Home Page
When you log in, your home page opens. Explore and interact with your data analytics environment, including dashboards, visuals, and reports (if enabled in your environment) in a variety of ways. This topic covers the different options and features available to you.In this release, when your admin enables the Enhanced Experience user interface, you will see changes to workflows you may have used in previous releases. If you are running an earlier release or your admin has not enabled the new interface, see View the Home Page (Earlier Releases).
View Your Home Page
Your home page components and main menu options are determined by the rights and privileges assigned to the user group you belong to, as defined by your system administrator. If you are a user with minimal access, your home page takes you directly to your Library work area for dashboards, and optionally, self service reports. You can navigate to Data Sources or Visual Gallery work areas, and access your profile to log out or switch tenants using the main menu.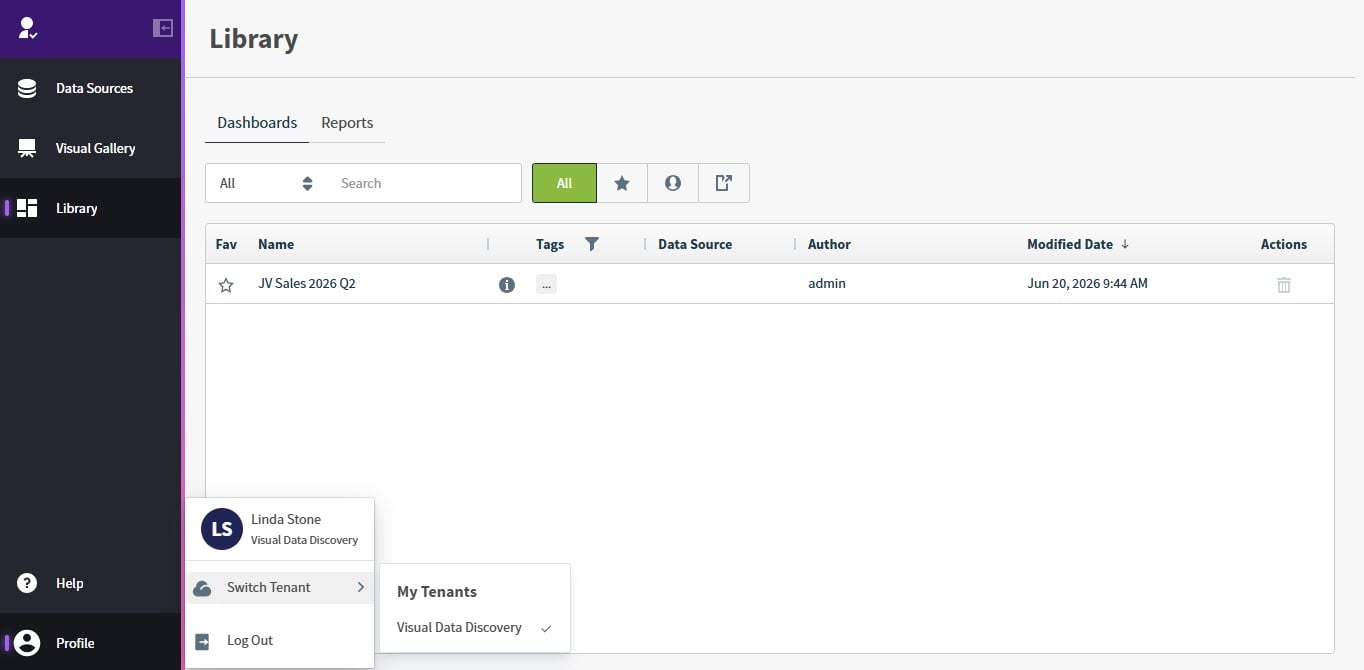
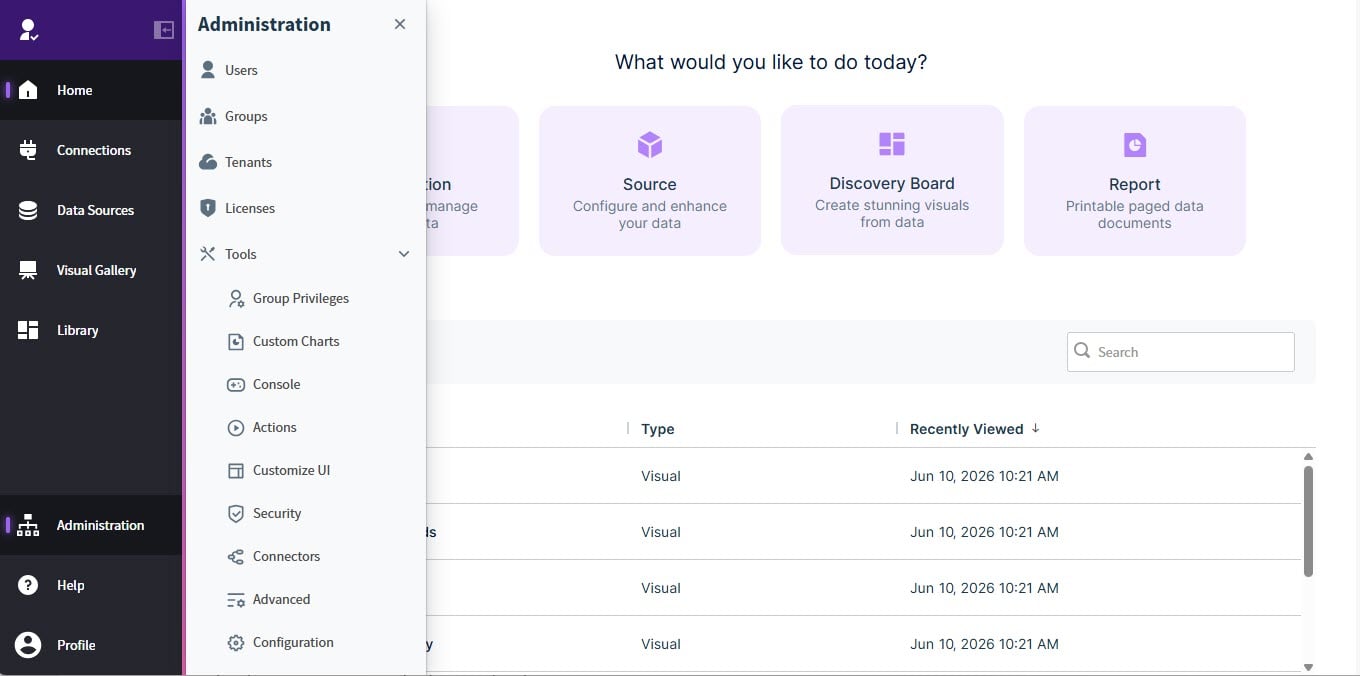
- Connection: Connect to and manage your data to use in Self-Service Analytics.
- Source: Configure and enhance your data for use in visuals, dashboards, and self service reports.
- Discovery Board: Create and design stunning visuals from your data in your Dashboards or Reports library.
-
Report: Create and generate printable paged data documents in your Reports library, when enabled in your environment.
To use self service reports, you will need to enable it in your environment. See Server-Level Variables.
- Generate Visuals with AI: Generate visuals of your data by providing natural language prompts.
The availability of elements on your home page depends on the access rights that were granted to your user account. See Authorize Self-Service Analytics Access for Users in Groups.
Switch Between Tenants
If you belong to more than one tenant, you can switch between the tenant you are working in using your profile menu. Select your profile from the menu, then select a tenant from the Switch Tenant menu.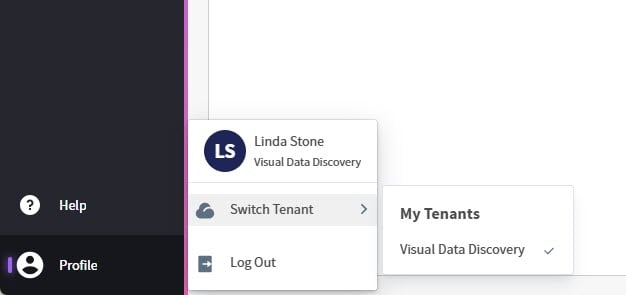
The Main Menu
The main navigation menus are located on the left side of Self-Service Analytics. The menu options you see are dependent on your application privileges and licensed features.In this release, when your admin enables the Enhanced Experience user interface, you will see changes to workflows you may have used in previous releases. If you are running an earlier release or your admin has not enabled the new interface, see UI Menu (Earlier Releases).
Main Menu Options for All Users
All users’ menus include:- An expand and collapse option. Expand and collapse the menu by selecting the expand or collapse icon at the top of the menu.
- A Data Sources option. Select this icon to navigate to the Data Sources work area.
- A Visual Gallery option. Select this icon to navigate to the Visual Gallery work area.
- A Library option. Select this icon to navigate to the Dashboard Library, and when enabled, the Reports Library.
- Help icon. Select to open product help, access Technical Support, or view information about your environment.
- Profile icon. Select to open the profile menu. View your user information, switch between tenants if you are a member of more than one tenant, or log out.
All Main Menu Options
The menu options you see are dependent on your application privileges and licensed features. Administrators, members of the Supervisors group, and the specific privileges your administrator defines for you determine what you can see, access, or manage.| Menu Option | Select this option to… |
|---|---|
| Expand / Collapse Icon | Expand or collapse the menu in any work area. |
| Connections | Review and manage the defined connections. See Create and Manage Data Store Connections. |
| Data Sources | Review and manage data source configurations. See Create and Manage Data Sources. |
| Visual Gallery | Review and manage shared visuals. See Use the Visual Gallery. |
| Library | Review and manage dashboards and self service reports in their libraries. See Use the Library for Dashboards and Use the Self Service Reports Library. |
| Generate Visuals with AI | Generate visuals with AI, if enabled in your environment. See Generate Visuals. |
| Administration | Several options are available to members of the Administrators Group:
|
| Tools (sub menu of Administration) |
|
| Help |
|
| Profile | View your user information, switch between tenants if you are a member of more than one tenant, or log out. |
Switch Tenants
In this release, when your admin enables the Enhanced Experience user interface, you will see changes to workflows you may have used in previous releases.
- Log in as a user assigned to multiple tenants.
- Select your profile in the main menu, then select Switch Tenant. A My Tenants menu opens, listing the names of the tenants you can access.
- Select the tenant you want to work in from the list of your tenants.
Filtering and Search Options
Find the content you need in your environment by searching for sources, visuals, dashboards, and self service reports in several ways: by item name, author, and tags you define for your items.Search and Filter Lists
If there are many items included in your work area, you may need to search and filter for what you need. You can use the search bar to perform a search, and a filter to filter all items or your search results, using built in filters or content tags.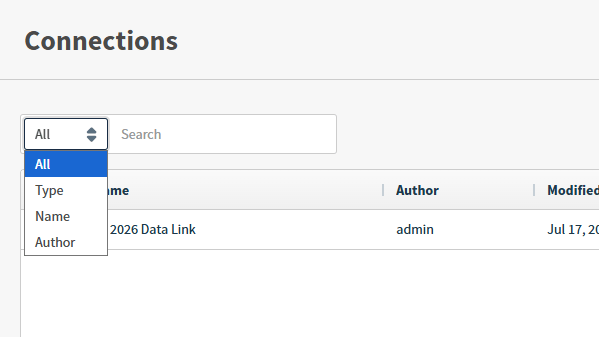
Use The Search Field
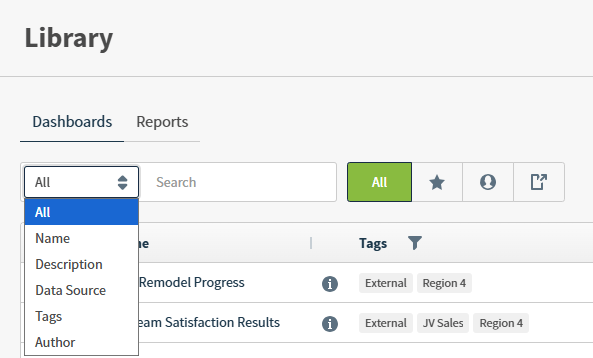
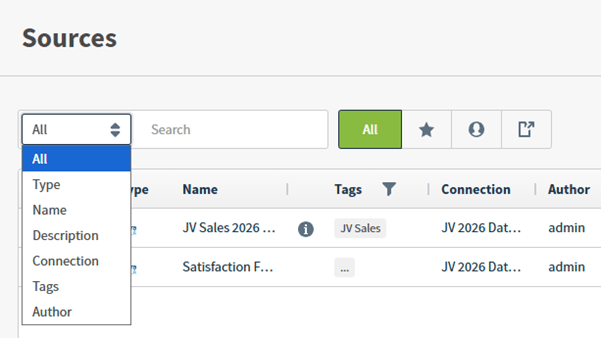
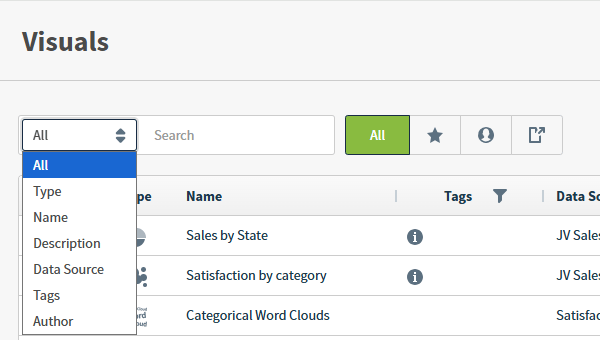
You can search many of the columns in your list to find what you need. Select All to search all searchable columns, or select an option available from the drop-down menu, such as Author, Name, or Type. Some work areas also allow you to search the text of a Description associated with an item.The columns you can search vary by work area.
Searches are performed from left to right, with no logical preference or grouping.
Optionally, use these column keywords in complex searches and map to columns in the list.
A column keyword is not searchable in a list that does not contain that column. For example, dashboards and reports do not include a Type column.
For example, in the Connections work area, the following search string would search for connections with names that include the characters
impala and that were created by user linda:
Filter Lists or Results
You can search for specific items using the search field, and narrow your returned results by selecting a content filter at the top of your work area. These filters are available in the Sources work area, the Visual Gallery, and the Library.| Filter | Description |
|---|---|
| All | Removes any filters for the list and displays all items of this type you can access within your Self-Service Analytics environment. |
 | Displays only items that you have marked as favorites. |
 | Displays only items that you created and saved. Visuals created and saved by other users are hidden. |
 | Displays only items that other users shared with you. See Grant Permissions for a Visual. |
Filter Lists and Search Results Using Tags
After you have added tags to one or more sources, visuals, dashboards, or self service reports, you can filter your view of these items by selecting one or more tags (or select items that do not have a tag, specifically). Filter your items using tags- Navigate to the work area you want to filter or search and filter (Sources, Visual Gallery, Library (either the Dashboards or Reports tab).
- Optionally, enter a search term in the Search field to find items in your list that match that search query.
- Select the filter icon for the Tags column header to open a drop-down selection list.
- Select one or more tags in the list by selecting (checking) the checkbox. The list changes to reflect items that included your selected tags criteria.
- Select any portion of the work area to hide the drop-down selection list and view your results.
- Clear the Search field and the filtered tags to return your entire list of items to the work area, or simply refresh the page.
Tags Drop-Down Selection List Options
The tags shown in your list are determined by the available tags in your environment. Tags are shared among sources, Visual Gallery visuals, dashboards, and self service reports. For example, if the sources in your instance only have two associated tags, while visuals dashboards, and self service reports have a broader range of associated tags, you will see all available tags in the drop-down selection list. Two options you can use to filter are not tags. They are listed at the top of the drop-down selection list: Select All (n) and [NONE].- Select All (n): Use Select All to quickly select or deselect all tags in the list by filling or clearing the checkbox.
-
[NONE]: Use NONE to return all items in the list that do not have associated tags.
- If you select NONE while any or all tags are selected, those selections are cleared, and only items with no tags are shown.
- If you select any other tag while NONE is selected, the NONE checkbox is cleared, and only items with selected tags are shown.
Keyboard Controls
If keyboard controls are supported for a UI widget, you can use the following keyboard controls instead of a mouse:| Keyboard Control | Description |
|---|---|
| Tab key | Use the tab key to move between areas of the widget. |
| Space bar | Use the space to select or clear a value or item in a widget. |
| Space bar + Up or Down Arrow key | Drag and drop items in the widget. Hold the space bar down while you use the up and down arrow keys. When you have placed reached the location where you want the item, push the space bar key again to place it. |
Access Your Self-Service Analytics Environment - Administrator
After you have completed installation, log in as the system administrator to start setting up your environment for your tenants and users.- Open a supported web browser. See caniuse.com.
-
If you have configured your firewall based on instructions provided, then use the following URL format:
Otherwise, use the following URL format:Ensure you replace the
<composer-server-IP-address>placeholder with the one you obtained when you identified your IP address.If you receive a message indicating that Self-Service Analytics is not accessible yet, it may not have completed its setup yet. Please wait a few minutes before trying again or opening a Support ticket. If you continue to have issues accessing the environment from your browser, open a ticket with insightsoftware Technical Support. - The browser issues a warning specifying that the security certificate is not trusted. This warning occurs because the certificate that is deployed is self-signed. The warning does not appear when deploying your own certificate. For now, select Proceed anyway.
- The first time that you access the login screen, you are asked to change the passwords for the admin user. See Supplied Users and User Groups for more details.
About Dialog
The About dialog identifies the version of Self-Service Analytics you are using and provides a link to the terms of service. Access by selecting About in the main menu. Log out of the product: Select Log out. View the Terms of Service by selecting the Terms of Service link.The Top-Level Navigation Banner
In this release, when your admin enables the Enhanced Experience user interface, you will see changes to workflows you may have used in previous releases. If you are running an earlier release or your admin has not enabled the new interface, see Top-Level Navigation (Earlier Releases).
In environments where the enhanced-experience toggle has been enabled, the top-level navigation option has been removed from the user interface. Access your content and navigate options using the main menu or home page.