
- Change metrics, rulers, colors, visual types, or otherwise modify a visual
- Group, filter, or sort visual data
- Use context menu options
- Copy, export, or delete the visual
- Create keysets from visual data
- Export visual data
- Integrate a visual into external applications
- Change the defaults set for a visual in the data source configuration visual defaults
Individual visual interactivity settings can be overridden by dashboard interactivity settings. When a dashboard overrides the interactivity settings specified for an individual visual, the visual’s interactivity settings are not changed, but they are ignored, and the visual interactivity settings specified by the dashboard are used.
You can include several controls for embedded visuals, allowing users to select and deselect favorite visuals, as well as filter the list of visuals in the embedded Visual Gallery by favorite status. See Use the Visual Gallery.
- Select the visual in the Visual Gallery.
-
Select the interactivity option (
 ) on the sidebar menu for the visual. The interactivity sidebar opens.
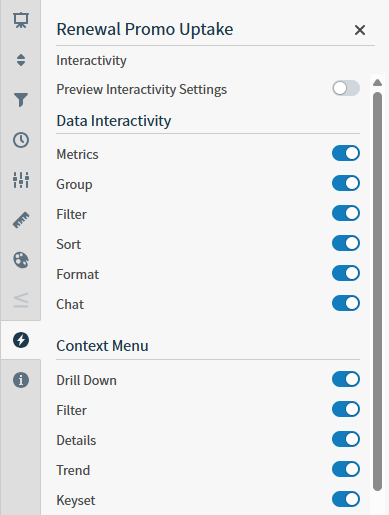
Visual Feature Group UI Setting JavaScript Setting Controls the ability to… Data Interactivity Metrics METRICSChange metric fields (other than a metric that might be in the Group field) on the axes for the visual. This setting also controls whether a user can control the aggregation method (SUM, AVG, MIN, MAX, etc.) used for metrics in a table. Group GROUPINGChange the Group field on the x-axis of the visual. This setting also controls whether a user can group tables. Filter FILTERFilter data using the Filter option from the visual drop-down menu and to the left of the visual name on a visual, or a display name if viewed in a dashboard. (To fully remove filtering functionality for a visual, be sure to turn off the Filter switch in the Context Menu settings on the interactivity sidebar too.) Sort SORTSort and limit the data in a visual. The sort and limit (  ) visual sidebar menu option is disabled when this switch is off and you cannot access the Sort & Limit sidebar.
Format FORMATFormat specific data in a visual. These formatting options are disabled when the switch is off. Context Menu Drill Down ZOOM_ACTIONDrill down into a selected data point on a visual using the Drill Down (formerly Zoom) option on the context menu. Filter FILTER_ACTIONFilter data using the Filter option on the context menu. (To fully remove filtering functionality for a visual, be sure to turn off the Filter switch in the Data Interactivity settings on the interactivity sidebar too.) Details DETAILS_ACTIONDisplay additional information about a specific visual data element using the Details option on the context menu. Trend TREND_ACTIONView trends for a selected data point using the Trend option on the context menu. Keyset KEYSET_ACTIONCreate a keyset from a selected data point using the Keyset option on the context menu. (To fully remove keyset functionality for a visual, be sure to turn off the Create Keyset switch in the Visualization settings on the interactivity sidebar too.) Actions ACTIONS_ACTIONInvoke an action using the Actions option on the context menu. (To fully remove actions functionality for a visual, be sure to turn off the Actions switch in the Visualization settings on the interactivity sidebar too.) Link LINK_ACTIONLink to another dashboard using the Link option on the context menu. Visualization Settings SETTINGSSpecify settings for the visual. The visual settings (  ) visual sidebar menu option is disabled when this switch is off and you cannot access the visual settings sidebar.
Rulers RULERSAdd visual reference lines and customize the markers used on the metric axis. The ruler settings (  ) sidebar menu option is disabled when this switch is off and you cannot access the ruler sidebar.
Colors COLORSChange the color palette used by the visual. The color settings (  ) visual sidebar menu option is disabled when this switch is off and you cannot access the color sidebar.
Conditional Formatting CONDITIONAL_FORMATTINGApply conditional formatting to data in the visual. The conditional formatting (  ) visual sidebar menu option is disabled when disabled.
Create Keyset KEYSETCreate a keyset from the visual data using the Create Keyset option from the visual drop-down menu. (To fully remove keyset functionality for a visual, be sure to turn off the Keyset switch in the Context Menu settings on the interactivity sidebar too.) Save SAVESave the visual. Save As SAVE_ASSave the visual using a new name. Copy COPYCopy a visual using the Copy Visual option from the visual drop-down menu. Actions ACTIONSInvoke an action using the Actions option from the visual drop-down menu. (To fully remove actions functionality for a visual, be sure to turn off the Actions switch in the Context Menu settings on the interactivity sidebar too.) Remove REMOVERemove a visual using the Remove Visual option from the visual drop-down menu. Re-Visualize (formerly Visual Style) VISUAL_STYLEChange a visual’s type. The re-visualize (was visual style) (  ) visual sidebar menu option is disabled when this switch is off and you cannot access this sidebar.
Select Time Bar Field TIMEBAR_FIELDChange the time field on the time bar. Maximize MAXIMIZEMaximize a visual for optimal viewing. Rename RENAMERename a visual. Show Time Bar Panel TIMEBAR_PANELShow the time bar for the visual. Info INFOAllow users to edit information in the Info sidebar menu. Exporting Export to PNG/PDF EXPORT_PNG_PDFExport a visual to PNG/PDF using the Export option from the visual drop-down menu. Export to CSV EXPORT_CSVExport a visual to a CSV file using the Export option from the visual drop-down menu. Export to XLSX EXPORT_XLSXExport a visual to an XLSX file using the Export option from the visual drop-down menu. - Slide the switches on or off for the interactivity settings you want to change.
- Optionally, preview the behavior with the interactivity settings applied. Slide the Preview Interactivity Settings switch on (to the right).
-
Select
 to save the visual.
Use the Context Menu
Users can use the context menu on all visuals to view more information about specific data points in visuals. This menu provides streamlined options for working with data. To access the context menu, select any data point in the visual, grouped or ungrouped, to explore or drill down into that data element.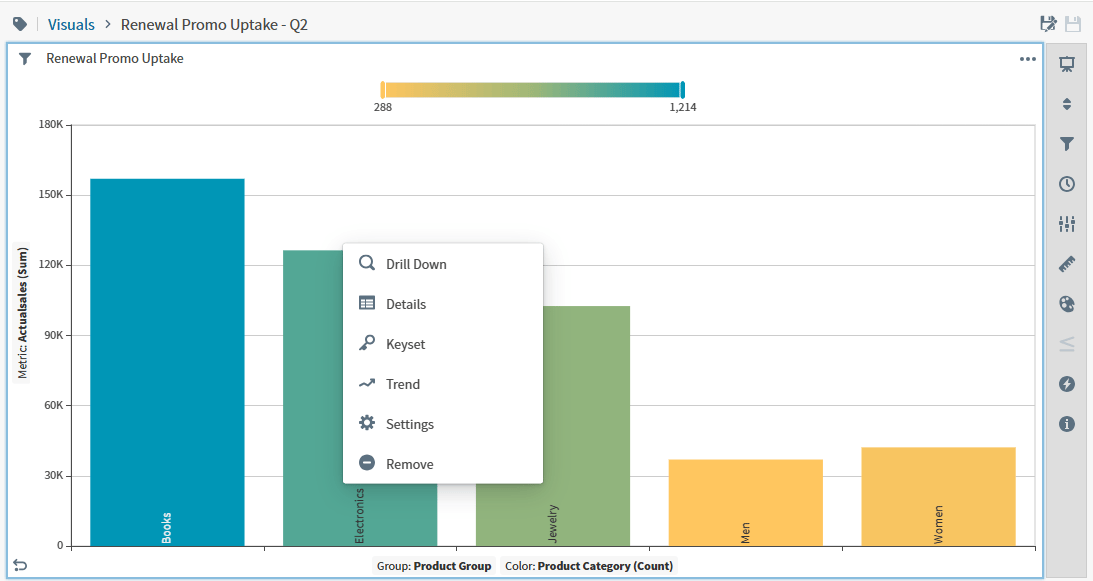
Details
To display additional information about specific data elements, select Details. The details for the element are displayed in a table.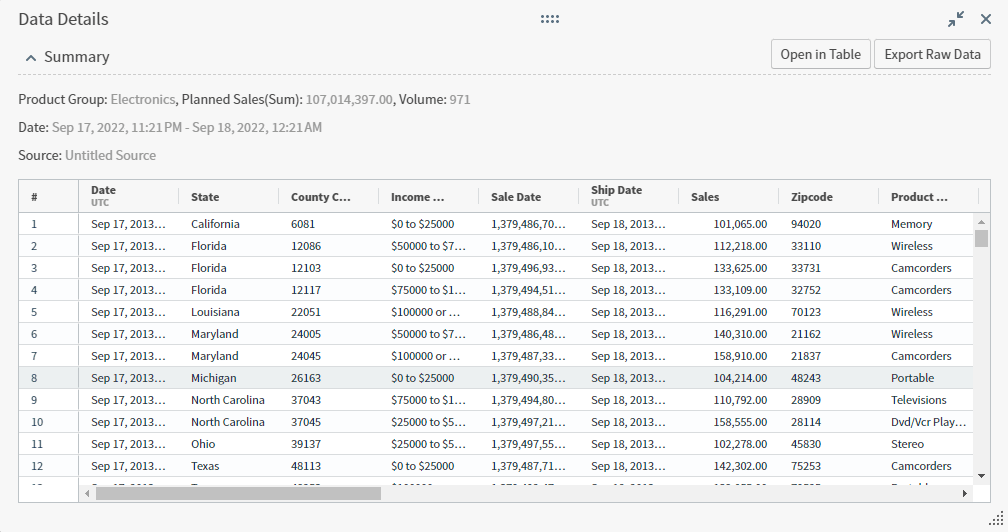
- Attribute whose details you have selected to view
- Metric
- Volume metric
- Time attribute and the selected time interval on the time bar
- Data source
Create Alert
Use Create Alert to create an alert for this visual and data element. See Create an Alert Definition.Filter
Use Filter to filter other visuals in the dashboard that are subscribed to same-source or cross-source links by the data point you have selected. For more information, see Apply a Filter to Dashboard Visuals Using the Context Menu. The context menu can be used to apply cross-visual filters to all visuals in a dashboard. If a visual subscribes to a link field, a context menu filter for the field from a different visual in the same dashboard will also be applied to the first visual. For example, if Visuals A and B are both subscribed to a link for field Z, and you use the context menu to apply a filter for field Z on Visual B, the filter will also be applied to Visual A. For information about controlling the publish and subscribe link settings for a visual, see Control How Cross-Visual Filters Interact in a Dashboard.Unlike row-level filters, cross-visual filters are not saved with the visual.
Keyset
Use Keyset to create a keyset from the selected data point. See Create a Keyset.Trend
Use Trend to view trends for a selected data point. Trend is not available for: Line and Bars Trend, Line Trend: Attribute Values, and Line Trend: Multiple Metrics.Drill Down (Formerly Zoom)
Use Drill Down (formerly Zoom) to focus on the selected data point and filter the results by another filter attribute in the data source. When you select Drill Down, a menu appears from which you select the second filter attribute. For example, if you wanted to see the actual sales for every county in the Electronics Product Group, select Electronics in the bar chart to bring up the context menu, select Drill Down, and then select the County attribute from the resulting menu. The result set in the bar chart might look like this: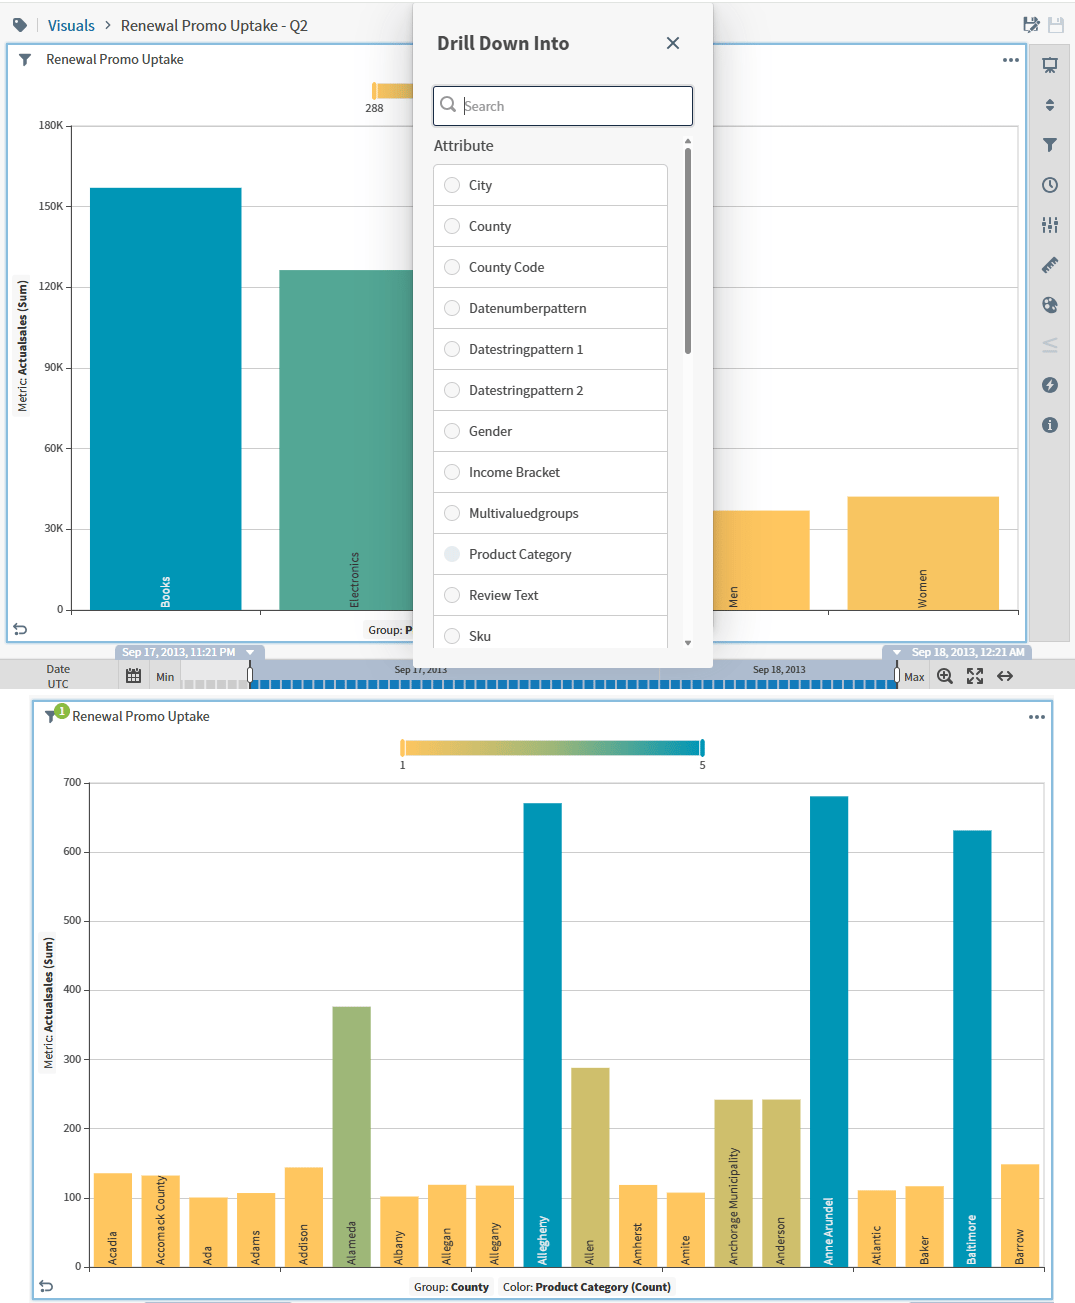
Link
Use Link to quickly access a dashboard that has been linked to this visual. Link is only available if a dashboard link has been defined for a visual. See Link a Dashboard.Actions
You must be logged in as an administrator or as a user with the Invoke Actions privilege.
- Creates a query definition based on the filters applied to the visual and on the data and limit specifications in the associated action template.
- Sends the query definition to your application. Your application can use the Self-Service Analytics API to run the query and display or use the data that it collects.