
To use self service reports, you will need to enable it in your environment. See Server-Level Variables.
Performance, Memory Management, and Scheduling
Self Service Reports are designed to provide flexible and efficient report generation while maintaining optimal system performance. Report complexity directly impacts memory consumption: advanced features and extensive data transformations require additional computational resources. To ensure the best reporting experience, we recommend careful data selection, mindful use of complex conditional formatting, and awareness of potential memory constraints during large-scale report generation. Layout, paper size and orientation for export, as well as conditional formatting and grouping can affect performance. More complex reports may require additional processing time and resources, so design the reports accordingly. For more information, see Report Type Performance. To ensure optimal performance and reliability when scheduling Self-Service Reports, keep in mind that this system is designed to handle multiple concurrent schedules efficiently. However, we recommend you space out schedules to avoid overlaps and potential conflicts. For more information, see Report Type Performance. Additionally, there is a limit on the size of emails that can be sent, determined by your SMTP provider that includes both the message body and any attachments. Exceeding this may result in delivery failures due to those restrictions. Before you begin, make sure that the data sources you want to use have been added and you have privileges to access the sources and create reports. Before you begin, make sure that the data sources you want to use have been added and you have privileges to access the sources and create reports. For more information, see:- Self Service Report Microservice
- Use the Self Service Reports Library
- Create Self Service Reports
- Format Self Service Reports
- Edit and Delete a Self Service Report
- Schedule a Self Service Report or Dashboard Report
- Scheduled Self Service Reports and Dashboard Report Prerequisites
- Use the Report Icon Bars
You can bypass the visualization cache and query the underlying data source by selecting the Refresh icon in the reports icon bar.
Create Self Service Reports
Generate and manage reports using the self-service reporting capability. Create customized reports using a table visual, adding a report header and footer as needed. Additionally, you can apply filtering, conditional formatting, and grouping to your data. Apply aggregate functions on different fields to produce the report you need. Export easily as a PDF or Excel (XLSX) file, including all of your customizations. When you create a report, the size, layout, paper size and orientation for export, as well as conditional formatting and grouping can affect performance. For more information, see Report Type Performance.Create a Self Service Report
In this release, when your admin enables the Enhanced Experience user interface, you will see changes to workflows you may have used in previous releases.
- Navigate to the Reports work area.
-
Select Create Report. A blank Untitled report work area opens. Edit an editable area of the report, or connect a data source using the Select source button to open the Select a Source modal.
Before or after you select a source, you can edit the title, header, footer, and trademark text of this report.
-
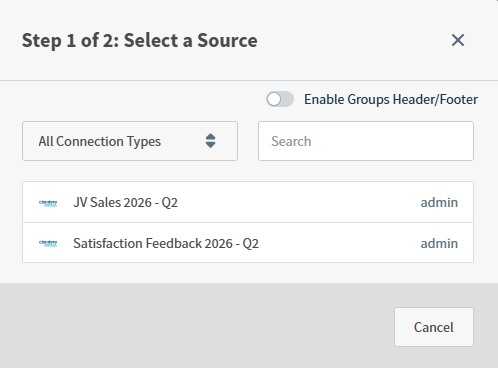
Select an available source from the options provided in the Select a Source modal. Scroll through the options, filter sources by connection type, or use the Search feature to find specific sources. After you make your selection, a Select Columns modal opens.
Optionally, enable the toggle provided to Enable Groups Header/Footer.Only sources with data that can be presented in a table are shown.
-
Select one or more columns from your data source to build your report. Scroll through the options or use the Search feature to find specific fields.
 Control the fields used and shown to users for self service reports by adjusting the field visibility in your sources. See Hide Fields.
 -
When you have picked all of the columns you wish to include in the report, select Create Report. After your report is generated, it displays the report data in an editable widget in the Untitled report work area.
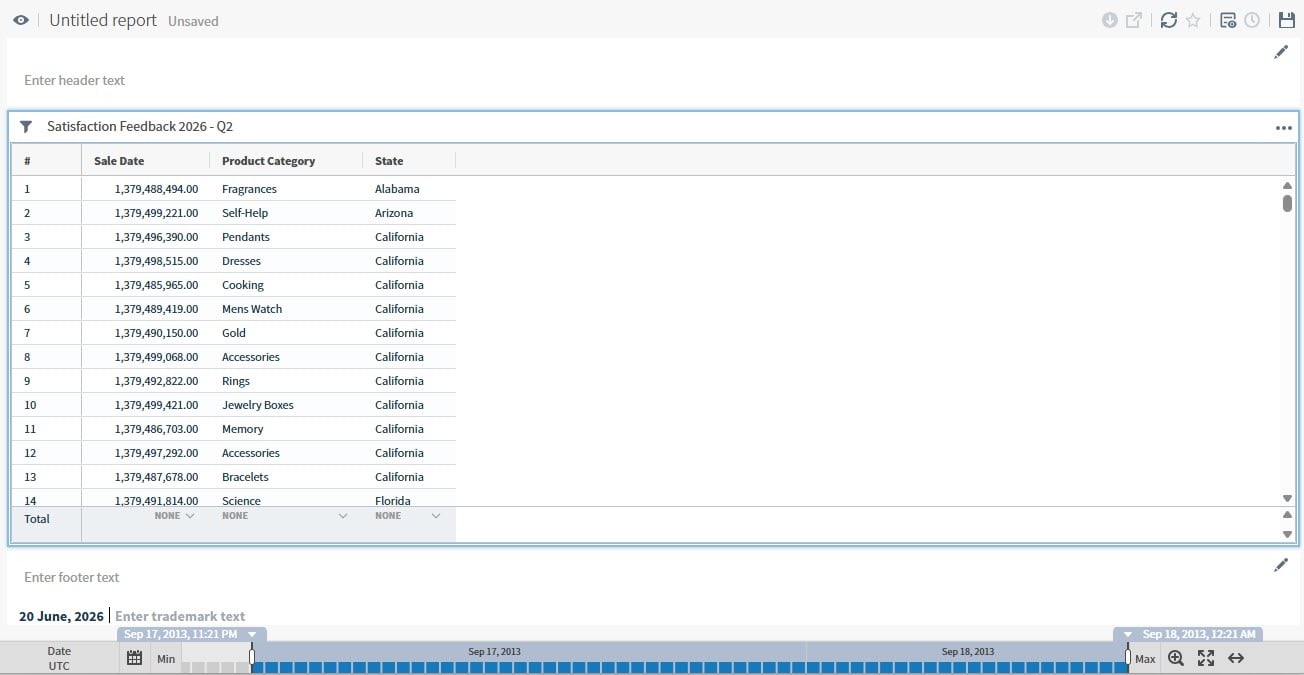
- Name and save your report when you’re ready, updating the name, adding a description, and assigning tags as needed. You can now edit this report: add and remove columns, group data, sort data, format your data, and apply conditional formatting. Optionally, edit the header and footer of this report, or select the Report Header & Footer icon to disable the header and footer of this report.
The Report Header and Footer
By default, the report header and footer are enabled for all reports. Select the Report Header & Footer icon in the reports icon bar to toggle the header and footer sections on and off.
- Select edit icon in the header or footer area of the report to make changes to it. The selected section expands and opens for editing. Apply formatting as needed. See Format Self Service Reports.
- Enter the header or footer text you would like to include, then select the edit icon again to save your changes. The section shrinks and your changes are visible in the report work area.
- By default, the current date is included in the footer work area, and you can optionally add trademark text, copyright information, or other static information alongside the date.
- When you are satisfied with your edits, Save your changes.
Conditional Formatting
Conditional formatting increases report generation time significantly. A report with conditional formatting can take from twice as long to significantly longer than an equivalent report without it. Conditional formatting in complex reports exported to PDF format place a higher load on your environment, resulting in a percentage of error rates. Self service reports support conditional formatting on reports with and without grouped data. You can apply conditional formatting rules as you would for a table visual. See Configure Conditional Formatting.Export Your Self Service Report
When your users create self service reports and scheduled service reports, this can induce some load on your environment and the self service microservice. This microservice was added to enhance performance of self service report creation and Excel (XLSX) exports with formatting and conditional formatting for table visuals and reports. For more information about performance considerations for self service reporting, exports of reports and table visuals, see Self Service Report Microservice.- After you create and save your report, or make changes to a report and save it, you can access and select the export icon.
- Select the export icon to open the export menu.
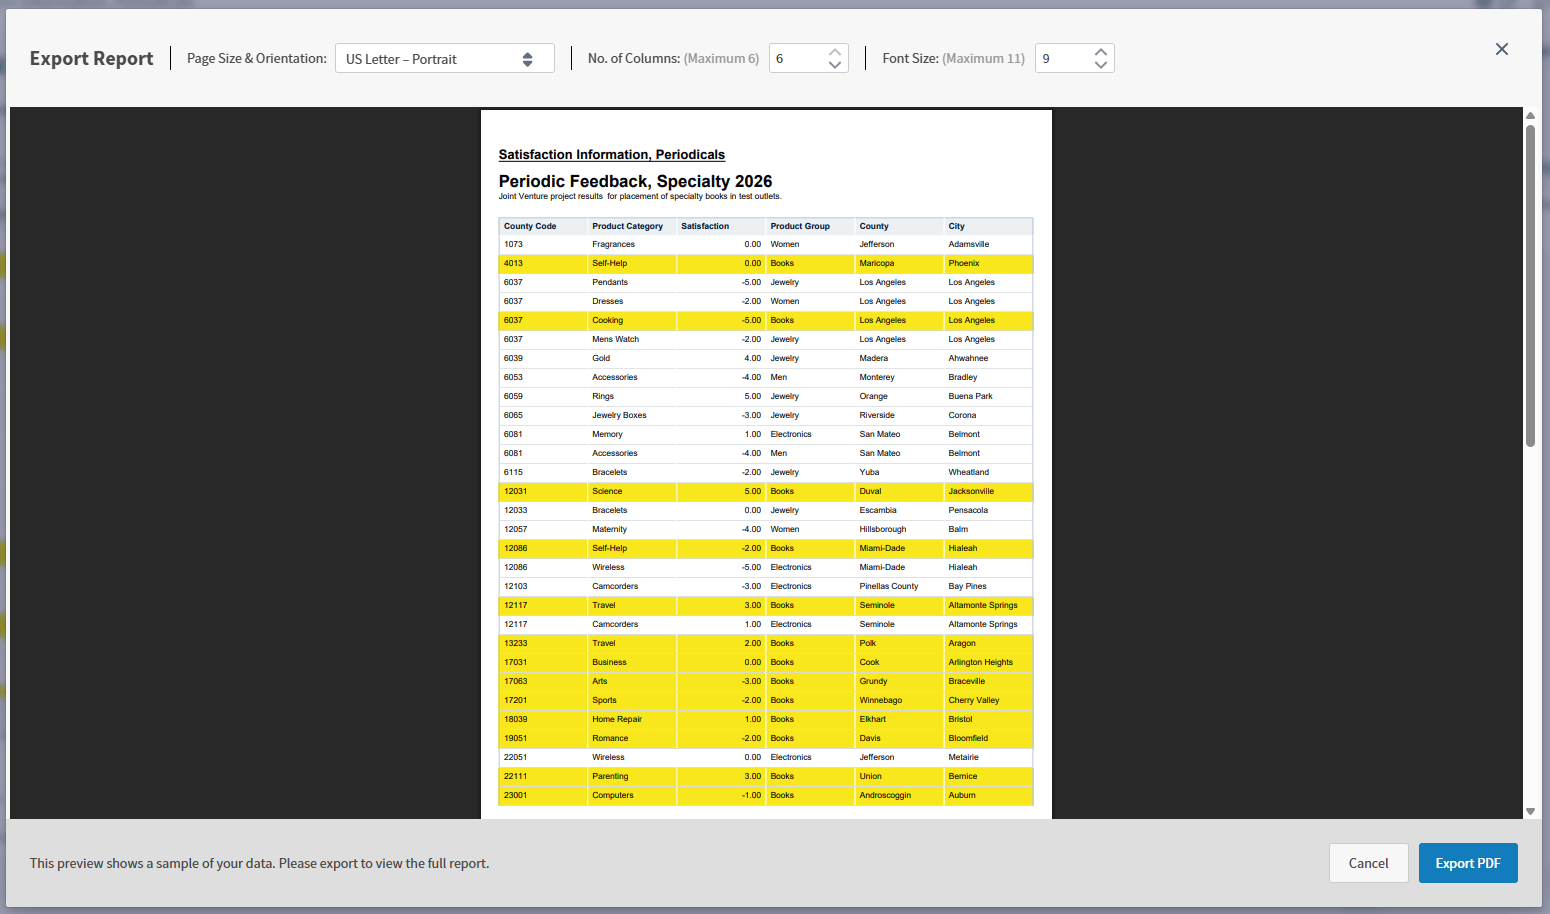
- Select PDF or Data (XLSX). If you select Data (XLSX), your data is prepared and downloads as formatted. If you select PDF, a preview window displaying the first few rows of entries in your report opens.
- By default, your PDF report previews with a Page Size & Orientation of US Letter - Portrait. Use this option, or select from other available layouts. Depending on the number of columns in your report, as well as page and orientation limitations, you can optionally select the number of columns to include up to a displayed maximum, and adjust the font size up to a displayed maximum.
- If you like the look of your report, select Export PDF to download the report. Select Cancel to go back and make changes to your report.
Page Size and Orientation
Page size and orientation options include:- US Letter - Portrait
- US Letter - Landscape
- A4 - Portrait
- A4 - Landscape
- A3 - Portrait
- A3 - Landscape
Edit and Delete a Self Service Report
All self service reports you create can be edited, updated, and deleted as needed. Edit the data in a self service report- Log in as an administrator or a user who has been assigned to a group who can create and edit self service reports.
- Select the Library option from the main menu, then the Reports tab in the library The library displays dashboards in a table (list) format.
- Select the report in the list. The report opens.
- Adjust the data in the report, adding or removing columns, grouping or ungrouping data, changing the order of columns, or applying conditional formatting as needed. Use the reports icon bar to make other adjustments, such as refreshing the data, marking the report as a favorite, or saving a copy of the report with a new name.
- Save your report.
- Log in as an administrator or a user who has been assigned to a group who can create and edit self service reports.
- Select the Library option from the main menu, then the Reports tab in the library. The library displays reports in a table (list) format.
- Select the report in the list. The report opens.
- Adjust the headers and footers. Toggle the Report Header and Footer widgets to enable or disable using reports icon bar. When enabled, select the Edit icon to change the info presented in the header and footer.
- Save your report.
- Log in as an administrator or a user who has been assigned to a group who can create and edit self service reports.
- Select the Library option from the main menu, then the Reports tab in the library The library displays reports in a table (list) format.
- Locate the report you want to delete.
- Select delete (
 ) icon in the Actions column.
 - Confirm by selecting the Delete button on the warning dialog.
- Edit the report.
- Select delete () icon from the reports icon bar.
- Confirm by selecting the Delete button.
Format Self Service Reports
Header and Footer Formatting
Format the header and footer rich text snippet widgets of your self service report to provide information about the report data. Provide context, link external resources, or add images. As you add and update your text, use keyboard shortcuts to undo and redo formatting changes. If you employ custom attributes in your environment, incorporate them as needed.
| Formatting Option | Description |
|---|---|
| Text Style (Paragraph Level Format) | Three text style options are available for formatting the text of your snippet at the paragraph level. After making a selection, you can apply additional format options as needed.
|
| Align | Align your paragraphs. There are four alignment options:
|
| Bold | Apply bold formatting to selected text, if the default text style is not bold. |
| Italic | Apply italic formatting to selected text. |
| Underline | Underline the selected text. |
| Bullet List | Select to start a bulleted list. Alternatively, select text and convert it to a bulleted list of body text. |
| Numbered List | Select to start a numbered list. Alternatively, select text and convert it to a numbered list of body text. |
| Add Image | Select to insert an image. Opens the Add Image work area.
Keep your header and footer image sized between 200kb and 500kb for optimal rendering performance. |
| Clear Formatting | Select to clear color and font formatting (bold, italic, underline) from a paragraph. |
Conditional Formatting
Conditional formatting increases report generation time significantly. A report with conditional formatting can take from twice as long to significantly longer than an equivalent report without it. Conditional formatting in complex reports exported to PDF format place a higher load on your environment, resulting in a percentage of error rates. Self service reports support conditional formatting on reports with and without grouped data. You can apply conditional formatting rules as you would for a table visual. See Configure Conditional Formatting.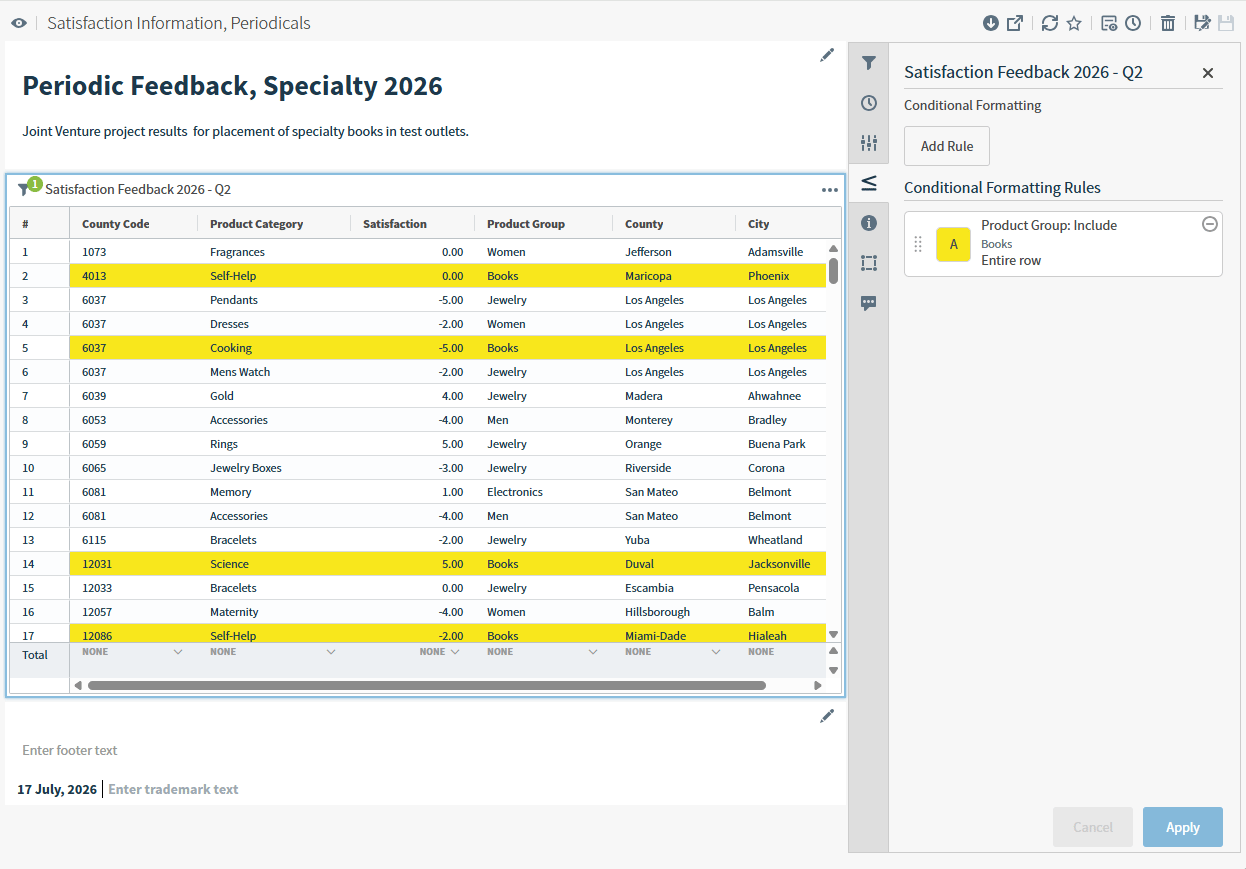
Use the Report Icon Bars
When you create or edit a report, a series of icons are available you can use to perform specific report functions.

The visibility of these icons on a report are affected by interactivity settings defined for dashboards in the library. See Control How Users Interact With a Dashboard.
| Icon | Description |
|---|---|
 | Toggle view mode between Viewer and Editor modes. |
 | Export a report. Enabled if there are no unsaved changes to your report. Select to open a preview window of your report; review and export or cancel the export. See Export Your Self Service Report. |
 | Share your report. |
 | Refresh the data in the report. |
 | Mark the report as a favorite. |
 | Select to enable and disable the header and footer. See Edit the header and footer in a self service report. |
 | Schedule a self service report to be sent. See Schedule a Self Service Report or Dashboard Report. |
 | Delete the report. See Edit and Delete a Self Service Report. |
 | Save a report with a new name (which copies it). |
 | Save a report. |
Use the Self Service Reports Library
The work area of the reports library contains all reports in your environment to which you have access. Make a report a favorite, delete it (if your privileges allow), and open the report. If you have not been given access to reports, you will see no reports in the reports library. You may be able to create reports, but you may not be able to save them. Contact your system administrator to increase your privileges.Access the Reports Library
To access the reports library, select the Reports card from the home page, or select Library on the menu, then the Reports tab. The reports library opens, and reports display in a table (list) format.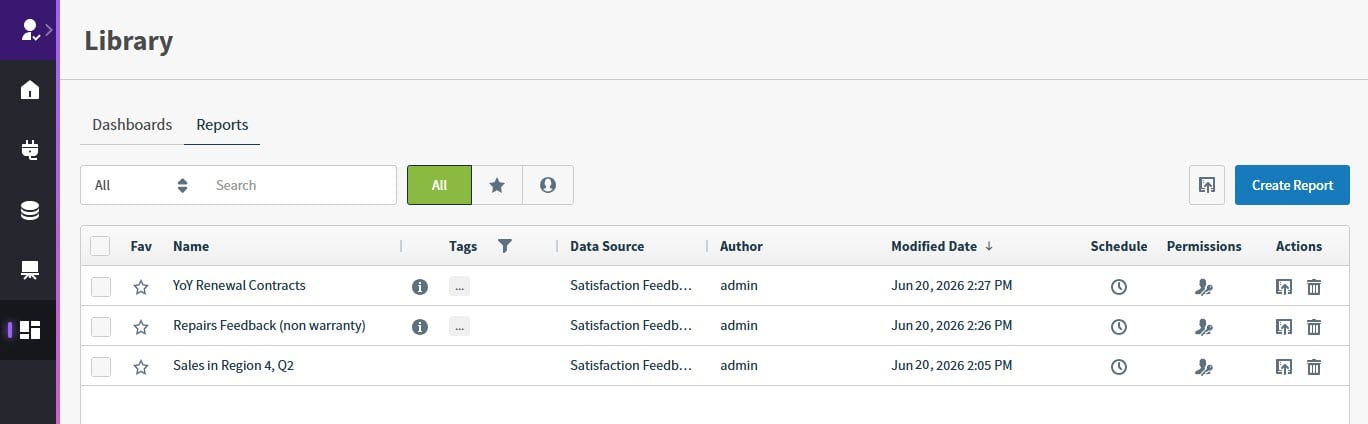
Search Field
You can use the search field to filter the reports in this work area by report Name, Description (if provided), Data Source, or Author. For example, if you type a C in the search box, only reports that include the letter C in the selected field searched are shown in the working area. See Search and Filter Lists.Buttons
The buttons on the page allow easy access to saved dashboards, as well as other dashboards created by other users in your environment. They also allow you to create a new dashboard, filter the dashboards that are shown, import, or export dashboards.| Button | Description |
|---|---|
| All | Removes any filters for the reports library and displays all reports available to you within your environment. |
 | Displays only the reports you have marked as favorites. |
 | Displays only reports you created and saved. Reports created and saved by other users are hidden. |
 | Select to generate an embeddable report link. |
List of Reports
The columns for this list are described below. Several of these columns can be used to sort the contents of the list: select the column header to sort first to last and again to sort last to first. You can search for items by the contents of several columns. See Search and Filter Lists.| Column | Description |
|---|---|
| Select (not labeled) | Select or deselect one or more items. |
| Fav | Identifies favorite reports using a star icon. If the star is colored ( ), the report is a favorite. If the star is empty ( ), the report is a favorite. If the star is empty ( ), the report is not a favorite. If you change the favorite status of a report while viewing or editing it, that change is reflected here. ), the report is not a favorite. If you change the favorite status of a report while viewing or editing it, that change is reflected here. |
| Name | The name of the self service report. This is a searchable field. |
| Description (not labeled) | The description icon is visible if a description associated with a report. This is a searchable field. |
| Tags | Content tags applied to the report. Select the filter icon to open a drop down list and select tags to filter your list or to narrow your search results. If several tags are associated with an item, hover over the ellipsis to see all tags for this resource. This is a searchable field. |
| Filter icon | Select to filter the contents by one or more content tags. |
| Data Source | The name of the data sources used by the report. This is a searchable field. |
| Author | The user who created the report. This is a searchable field. |
| Modified Date | The date the report was last modified. |
| Schedule | Select the clock ( ) in this column to create a scheduled for this report. The Scheduled Reports dialog appears. ) in this column to create a scheduled for this report. The Scheduled Reports dialog appears.See About Scheduled Reports. |
| Permissions | Select the permissions icon in this column to assign permissions to a report. The Report Permissions dialog appears. |
| Actions | Shows icons you can select to perform actions for the report.
|