
You must be an administrator to manage custom visual types.
- Maintain Custom Charts Using the Custom Chart CLI
- Manage Custom Charts in the UI
- Visual Type Configuration Properties
- Custom Chart API
Manage Custom Charts in the UI
This section describes how you can manage custom charts in the Self-Service Analytics UI.You must be an administrator to manage custom visual types.
List Custom Charts
Custom charts that have been imported into Self-Service Analytics are listed on the Manage Custom Charts page in the UI. Access the Manage Custom Charts page- Log into the user interface as an administrator.
- Select Tools > Custom Charts from the Administration menu. The Manage Custom Charts page appears.
Import a Custom Chart Using the UI
You can import a custom chart using the Self-Service Analytics UI as well as using the Logi Composer CLI. This topic describes how to import a custom chart using the UI. See Maintain Custom Charts Using the Custom Chart CLI for information about using the CLI to import a custom chart. Import a custom chart using the user interface- Log into the UI as an administrator.
- Access the Manage Custom Charts page. See List Custom Charts.
-
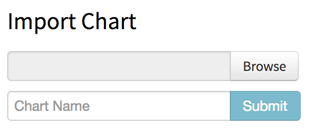
Locate the Import Chart area of the Manage Custom Charts page.
-
Select Browse and locate and select the
.zipfile of the custom chart you want to import. - Enter a visual name for the imported visual.
- Select Submit. The visual is imported.
Download a Custom Chart
Download a custom chart- Log into the UI as an administrator.
- Access the Manage Custom Charts page. See List Custom Charts.
- Locate the visual in the table of visuals.
- Select the download icon for the visual. The
.zipfile for the visual is downloaded.
When you download the visual from the Manage Custom Charts page, the zip file includes a file called
version that contains the version of the Self-Service Analytics server. If you later try to import this zip file to a Self-Service Analytics server using a different version an error will occur indicating that the versions do not match. An easy workaround is to modify the version in the version file before trying the import.Delete a Custom Chart
Delete a custom chart- Log into the UI as an administrator.
- Access the Manage Custom Charts page. See List Custom Charts.
- Locate the visual in the table of visuals.
- Select the delete icon for the visual in the Delete column of the table.