
| Icon | Description |
|---|---|
 | Visual Gallery visuals are visuals created by users and saved in the Visual Gallery. Share these visuals with other users to use in multiple dashboards. Any changes you make and save to a visual are reflected on all dashboards that include the shared visual. |
 | Local visuals are visuals created by users directly on a dashboard. These visuals are unique to the dashboard. Any changes you make are saved when you save the dashboard. |
The Visual Interface
Self-Service Analytics’s canvas provides a comprehensive suite of tools to help you conduct in-depth analysis, filter data points, and discover needed insights quickly and efficiently.Tools in the Visual Interface
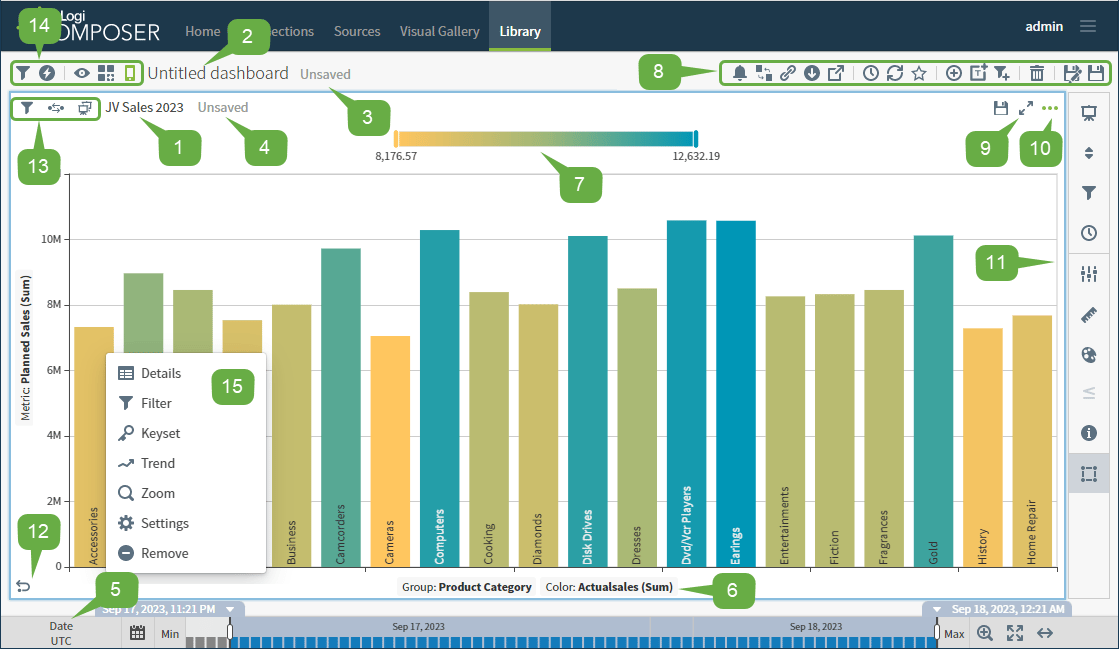
- Display Name: By default, a visual’s display name is the name of the data source used for the visual for local visuals, or the display name for a visual from the visual gallery. Select the title to edit.
- Dashboard Name or Title: The dashboard name if editing a visual in a dashboard. Select the name to edit it or save the dashboard to be prompted for a dashboard name. The default name of the dashboard is Untitled dashboard.
- Indicates whether the dashboard has been saved. This information is not available if you are editing a visual from the Visual Gallery.
-
Indicates whether a visual gallery visual has been saved.
- If the visual is a local visual, this area is blank. All local visuals are saved when you save the dashboard.
-
Time Bar and Time Controls:
- Filter your data by a time attribute.
- Zoom into specific period within the selected date range.
- Explore the dynamics of your data using the Play/Pause button.
- X- and Y- Axis Labels and the Color Metric (availability varies, depending on the visual type): Select an axis label to change an attribute or metric. See Change the Axes and Change the Visual Color Metric. If you disable the Volume property in a data source configuration, it does not appear in visual tooltips. The only exception to this is in histograms which plot the volume or number of records.
- Legend: By default, a legend is available for supported visual types, and can be switched on or off in the Colors sidebar menu.
- The dashboard icon bar. Use the options here to manage the dashboard. See Use the Dashboard Icons. This is only available on a dashboard; not on a visual edited from the Visual Gallery.
-
Select
 to expand a visual on a dashboard. This allows you to get a closer look at it. This is only available on a dashboard; not on a visual edited from the Visual Gallery.
-
The
 at the top right of a visual displays the visual drop-down menu. This menu includes an option to open Settings for the visual, and its sidebar menu.
- The visual sidebar menu. Select a sidebar menu option to open an appropriate sidebar for a visual. See Use the Visual Sidebar Menu.
-
Select
 to undo the most recent change you made to a visual.
-
Visual-specific options:
- Select
 to filter the data on a visual.
 - Select
 to view published filters.
 - The visual icon indicates if a visual is local () or a visual gallery visual ().
- Select
-
Dashboard-specific options:
- Select to filter the data on a dashboard. The dashboard-level filter icon is available only when all visuals on a dashboard are from the same data source.
- Select
 to open dashboard and visual interactivity settings.
 - Select
 to toggle dashboard view mode between Viewer and Editor modes.
 - Select
 to enable and disable locking the dashboard layout.
 - Select
 to enable and disable responsive layout for this dashboard. See Use the Responsive Dashboard Layout.
- Select
- The context menu. Use menu options to view or adjust data. See Use the Context Menu.
Visual Setup
Control visuals available for each data source configuration you create using the Available Visual Types work area. See Available Visual Types. After saving a data source definition, adjust settings applicable to new visuals on the Global Settings Work Areas. To add a visual, see:- Create Dashboards
- Create and Add Visuals to the Visual Gallery
- Manage Visuals
- Add Local Visuals to a Dashboard
- Add Existing Visuals to a Dashboard
Edit Visuals
Edit visuals directly on a Self-Service Analytics dashboard or in the Visual Gallery. When you modify a visual from the Visual Gallery and save your changes, the changes are made to the visual in the Visual Gallery and everywhere the visual is used on dashboards. To edit a visual, you must be logged in as a user belonging to a group with the privilege Administer Visuals enabled. Edit a visual- Select the visual on a dashboard or in the Visual Gallery. When selected on a dashboard, a blue border appears around the visual. If you select a visual with a streaming data source, the time bar (Data DVR) appears.
-
Depending on the edits you need to make, select an item on the visual drop-down menu () or one of the sidebars for the visual. You can also use the axes labels on the visual to change what is displayed and the context menu to visualize the data on your visual, adjust the settings, and more.
Some of the options described here can be performed in the Visual Gallery, some only when editing the visual in a dashboard, and some in both.
Edit Option Procedure Visual Gallery/ Dashboard/Both Change the data shown Depending on the style of the visual, select new data fields in the axes labels. See Change the Axes Both Change the visual type Select the re-visualize icon  on the sidebar menu. See Re-Visualize (Change a Visual Type).
Both Modify the colors Select  on the sidebar menu. A corresponding sidebar appears. See Change Color Schemes.
Both Modify the rulers and reference lines Select  on the sidebar menu. A corresponding sidebar appears. See Rulers and Reference Lines and Use Reference Lines.
Both Modify visual information Select  or
or  on the sidebar menu. A corresponding sidebar appears. See Modify Visual Names, Display Names, and Descriptions.
Both Modify visual settings Select  on the sidebar menu. A corresponding sidebar appears. See Change Visual Settings.
Both Manage the visual time bar Select  on the sidebar menu. A corresponding sidebar appears. See Use the Time Bar.
Both Sort or otherwise limit the visual Select  on the sidebar menu. See Sort and Limit Visual Data
Both Apply new or saved filters to your visual Select  to the left of the visual name or select on the sidebar menu to display the Filters sidebar. Use the Filters sidebar to add and apply a new filter to your data or to select a saved filter to apply to your data. See Filter Data.
Both Apply Conditional Formatting Select  on the sidebar menu to display the Conditional Formatting sidebar. Apply color and text formats based on conditional rules. See Use the Conditional Formatting Sidebar.
Both Adjust visual interactivity Select on the sidebar menu. See Control How Users Interact With a Visual.Visual Gallery Create a keyset Select and Create Keyset from the visual drop-down menu. See Create a Keyset.Both Invoke an action Select and Actions from the visual drop-down menu. See Invoke an Action.Both Export the visual Select and Export from the visual drop-down menu. See Export Visuals.Both Copy the visual Select and Copy Visual from the visual drop-down menu. See Copy Visuals.Dashboard Save the visual Select  . Changes are saved in the dashboard and in the Visual Gallery.
Dashboard Remove a visual from the dashboard Select and Remove Widget from the visual drop-down menu. See Delete and Remove Visuals.Dashboard Add or view widget comments Select  from the sidebar menu. See Widget Comments.
Dashboard - Optionally, edit the number or date and time format for this visual. See Number and Date Formatting for Visuals and Configure Date and Time Formatting.
- Make your changes.
- When you have finished making changes to your visual, be sure to save it. See Configure Visual Names, Descriptions, and Properties.
Use the Visual Sidebar Menu
Self-Service Analytics’s visual canvas provides a comprehensive suite of tools to help you tailor visuals quickly so they provide the information you need in the best way for you to analyze your data. These tools are available from the visual menu and from the visual sidebar menu. This topic discusses the visual sidebar menu. The visual sidebar menu appears to the right of every visual edited from the Visual Gallery. With the exception of the visual interactivity option, it is also available when you select Settings on the visual menu when editing a visual in a dashboard. Selecting options on the visual sidebar menu opens and closes sidebars that allow you to control:- The type of a selected visual
- The settings used for a selected visual
- The configuration of pivot tables and tables of raw data
- The filters used for a selected visual
- Time bar settings for a visual
- Sort and limit options for a selected visual
- Ruler and reference line settings for a selected visual
- Colors for a selected visual
- Interactivity settings for a selected visual (only available in the Visual Gallery)
- General information for a selected visual
- View and manage comments, if applicable, for a visual or widget
Visual Sidebar Menu
When you are editing a visual on a dashboard, you must first select a visual (a blue border appears around the selected visual) and then select Settings on the visual drop-down menu. This makes the visual sidebar menu available. If an option on the visual sidebar menu cannot be selected, the settings controlled by that sidebar are not available for the visual type you have selected. The following visual sidebar menu options are available:| Menu Option | Opens Sidebar |
|---|---|
| Opens or closes the Re-Visualize (was Visual Style) sidebar. Use this sidebar to change the visual type used for the selected visual (for example, to change a pie chart to a donut chart). See Use the Re-Visualize Sidebar. This option is not available for list filter visuals. |
| Opens or closes the Sort & Limit sidebar. Use this sidebar to sort and limit the data for the selected visual. See Sort and Limit Visual Data. This option is not available for list filter visuals. |
| Opens or closes the Filter sidebar. Use this sidebar to filter the data for the selected visual. See Apply Row-Level Filters, Apply Wildcard Filters to a Visual, Filter Snippet, or Dashboard, Group Filters, Create a Keyset From a CSV File, and Review and Apply a Keyset as a Visual Filter. |
| Opens or closes the Time Bar sidebar. Use this sidebar to control the time bar for the selected visual. See Use the Time Bar Sidebar. This option is not available for list filter visuals. |
| Opens or closes an appropriate Visual Settings sidebar. Use this sidebar to change settings for the selected visual. Different settings can be altered for different visual types. In addition, some visual types do not have any settings you can control in this way; this icon is disabled for these visual types. See Change Visual Settings. |
| Opens or closes the Ruler sidebar. Use this sidebar to control the rulers and reference lines on the selected visual. See Rulers and Reference Lines and Use Reference Lines. This option is not available for list filter visuals. |
| Opens or closes the Color sidebar. Use this sidebar to change the color settings for the selected visual. Different color settings are available for different chart styles. See Change Color Schemes. This option is not available for list filter visuals. |
| Opens or closes the Conditional Formatting sidebar. Use this sidebar to define table formatting for specific data based on the attributes and conditions you set. See Use the Conditional Formatting Sidebar. |
| Opens or closes the visual interactivity sidebar. Use this sidebar to control how users can interact with the selected visual. See Control How Users Interact With a Visual. This option is only available for a visual when you are viewing it in the Visual Gallery. |
| Opens or closes the visual information sidebar. Use this sidebar to view basic information for the selected visual, and edit the Visual Description when opened in the Visual Gallery. The Visual Description you can access here is not the same as the generated visual summary description you can generate and add to a rich text snippet in a dashboard. See Describe Visual (Generate Visual Summary Description) |
| Opens or closes the widget settings sidebar. Use this sidebar to edit basic information and reposition a widget in a widget cell for the selected visual. See Modify Visual Names, Display Names, and Descriptions and Position Resized Widgets . |
| Opens or closes the comments sidebar. View comments, or add and manage comments, depending on your dashboard access role. Use this sidebar to edit basic information for the selected visual. See Widget Comments. |
Use the Visual Drop-Down Menu
Self-Service Analytics’s visual canvas provides a comprehensive suite of tools to help you tailor visuals quickly and provide the information you need in the best way for you to analyze your data. These tools are available from the visual drop-down menu or from the visual sidebar menu. This topic discusses the drop-down menu. The visual drop-down menu lists options that help you modify and use your visuals more effectively. Access by selecting the Visual Menu, labeled as the Show more menu () icon in the upper right corner of a visual.
The menu options are described in the following table. Some options are only available for specific visual types. Some options are available when you are working with a visual in a dashboard and are not available when you are working with a visual in the Visual Gallery. Controls for some of these options are available on the interactivity sidebar. See Control How Users Interact With a Visual.
The list of options available on an embedded visual’s drop-down menu depends on:
- The mode setting for the dashboard. If the embed mode is
readonlyor Read Only, no menu is available at all. - The visual interactivity settings specified in the visual definition.
- The dashboard interactivity settings specified for the dashboard, if those settings include override interactivity settings for all visuals in the dashboard.
editor.placement property.
-
If
editor.placementis set todockRight, the options appear in sidebars using the visual sidebar menu and the resulting sidebar editing panels. Ifeditor.placementis set tomodals, the options appear in the visual drop-down menu itself and the resulting floating dialogs.
Visual Drop-Down Menu
| Option | Description |
|---|---|
| Add to Visual Gallery | Add a local visual to the Visual Gallery. See Convert Visual Gallery Visuals and Local Visuals. |
| Actions | Invoke an action if an action template has been enabled for the visual’s data source. See Invoke an Action. |
| Convert to Local | Make a copy of a visual gallery visual as a local visual on the dashboard. See Convert Visual Gallery Visuals and Local Visuals. |
| Copy Visual | Copy a visual. See Copy Visuals. |
| Create Keyset | Create a keyset from the visual data. See Create a Keyset. |
| Create Alert | Create an alert from the visual data for this dashboard. See Create an Alert Definition. |
| Describe Visual | Generate a visual summary description of the visual for most visual types. This visual summary description is saved at the dashboard level when you insert it into a new or existing rich text snippet. If you make changes to the visual, the changes are reflected in the visual summary description.
If more than one rich text snippet widget exists, you can select the appropriate snippet from a list. |
| Export | Export a visual or visual data. See Export Visuals. |
| Maximize | Maximize a visual on the dashboard for optimal viewing. |
| Minimize | Minimize a visual so you can see other visuals on the dashboard. |
| Permissions | Quickly allows you to update the user, group, and account permissions for the visual. The Visual Permissions dialog appears. See About Visual Permissions. You can only see this option if your user account has been granted the Manage Visual Permissions privilege. |
| Remove Widget | Remove a visual from the dashboard. This will delete local visuals, but will not delete visual gallery visuals from Self-Service Analytics. For more information, see Delete and Remove Visuals. |
| Save As | Save the visual with a new name. See Save Visuals With New Names. |
| Settings | Opens the sidebar menu for a visual. See Use the Visual Sidebar Menu. Formerly Edit. |
| Undo | Undo a change you made to the visual. See Undo a Visual Action. |
Change Visual Settings
You can change the settings for your visual using the Visual Settings sidebar. You can only change settings for some visual types. Access the Visual Settings sidebar- Select the visual in the dashboard for which the settings will be changed.
-
Select the visual settings icon () on the sidebar menu for the visual. If there are no settings you can modify for a specific visual type, the visual settings icon is disabled.
An appropriate visual settings sidebar appears. The one below is for a bar chart.
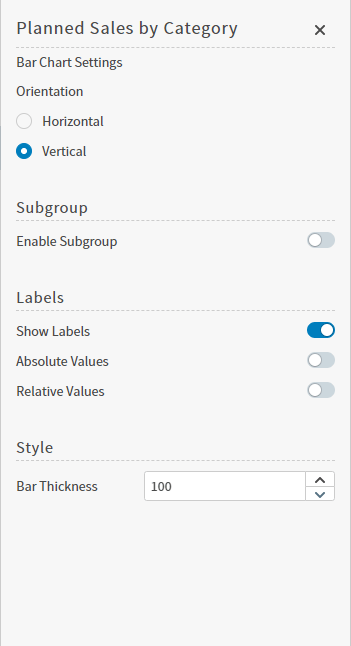
- Adjust the settings as needed. See the description of the specific visual type for more information.
Undo a Visual Action
The Undo option is available for visuals only. When you alter the query for a visual, the Undo option appears on the visual drop-down () menu and as an icon ( ) in the bottom left corner of the visual. Selecting Undo removes the most recent action you have taken for a visual and returns it to its previous state.
Undo is only available if you alter the visual query. This can include adding filters for a visual, changing its attributes, sorting its data, changing the visual type by re-visualizing the visual, changing the colors, and adjusting the time bar. The query is not altered if you export the visual, change its name or change its general information.
) in the bottom left corner of the visual. Selecting Undo removes the most recent action you have taken for a visual and returns it to its previous state.
Undo is only available if you alter the visual query. This can include adding filters for a visual, changing its attributes, sorting its data, changing the visual type by re-visualizing the visual, changing the colors, and adjusting the time bar. The query is not altered if you export the visual, change its name or change its general information.