
Set a Filter in a Visual or Dashboard
-
Select the filter icon on the visual or dashboard to access the appropriate filter sidebar.
- To access the filter sidebar, select its filter icon
 or select Settings from the Show More menu (
 ) and then select the filter
  on the sidebar menu.
 - To access the dashboard filter sidebar, select its filter icon . The dashboard-level filter icon is available only when all the visuals are from the same data source.
- To access the filter sidebar, select its filter icon
- Select Add Filter. An Add Filter work area opens to the Row tab, and includes Group and Saved tabs.
- Select the Row tab. If the style of your visual is an arc gauge, KPI chart, table (raw data), histogram, or map markers chart, the Group tab is available, but you cannot create a group filter because all filters for these visual types are row-level filters. If you are using the dashboard filters sidebar, the Group tab is not available. The Saved tab shows saved filters that you can apply to a dashboard or visual. See Save and Maintain Filters.
-
On the Row tab, select the filter attribute you want to use from the list of available attributes. A Select Values work area opens that you can use to select values and define this filter’s specifics. See the table below for available options.
Tab Description Value The Value tab allows you to select: - A filter operator (Include or Exclude, depending on whether you want to include or exclude the value from the data).
- An optional custom value. To create and select a custom value, enter the value in the Customize field and select Add. Your custom field is added and selected in the list of possible values. To remove the custom value, uncheck it in the list of possible values. It is removed from the filter and from the list of possible values for the filter.
- One or more values from the list of available values for the attribute you selected. To select all values, select Select All.
Use the search bar to quickly find a value. You can type the name of the value in the Search bar (or characters in the value name) to limit the list of values. A maximum of 1000 values are listed. If no values are listed or if you cannot find your value, type the exact name of the value (as stored in your data) into the Search bar and select the add icon to select it. This will force your instance to use this value when sending the query to the data store.
See Apply Row-Level Filters.Wildcard The Wildcard tab allows you to specify a wildcard filter for the attribute. See Apply Wildcard Filters to a Visual, Filter Snippet, or Dashboard. Keyset The Keyset tab allows you to select a keyset filter for the attribute. See Use Keysets for instructions on using keysets in a filter. You can also select the add icon to access the Derived Field Editor or the Custom Metrics Editor to create or modify derived fields and custom metrics to be used as filters. See Access the Derived Field Editor from the Filters Sidebar and Access the Custom Metrics Editor from the Filters Sidebar. -
After you have defined the filter specifics, select Continue. After confirming your changes, select Apply.
- Filters you create at the dashboard level are applied to all the visuals in the dashboard that use that source.
- Filters you create at the visual level apply only to the selected (active) visual.
Optionally, nest multiple filters for more targeted filtering results. Select Nest Filters, then link multiple filters using
AND and OR filtering.Additional Attribute Filters in a Filter Snippet
When you create a new filter snippet, you define the initial data type, operator, data source, and value column to use in Data Settings. You can add additional filters, including nested filters, as needed.- Open your existing filter snippet.
- Select the Filters option from the Filter Snippet sidebar.
- Select Add Filter. An Add Filter work area opens to the Row tab, and includes Group and Saved tabs.
-
Select or create a field to filter from available options on the Row or Group tab.
- Select an existing available field from Attribute, Number, Time, or Hierarchy and define appropriate options to use.
- Alternatively, elect the add icon to add a derived field or custom metric, and define appropriate options to use.
- After you have defined the filter specifics, select Continue. After confirming your changes, select Apply.
Optionally, nest multiple filters for more targeted filtering results. Select Nest Filters, then link multiple filters using
AND and OR filtering.Set a Numeric Field Filter
You can filter visual data by the values in a numeric field.Set a Filter in a Visual or Dashboard
-
Select the filter icon on the visual or dashboard to access the appropriate filter sidebar.
- To access the filter sidebar, select its filter icon or select Settings from the Show More menu () and then select the filter on the sidebar menu.
- To access the dashboard filter sidebar, select its filter icon
 . The dashboard-level filter icon is available only when all the visuals are from the same data source.
- To access the filter sidebar, select its filter icon
- Select Add Filter. An Add Filter work area opens to the Row tab, and includes Group and Saved tabs.
- Select the Row tab. If the style of your visual is an arc gauge, KPI chart, table (raw data), histogram, or map markers chart, the Group tab is available, but you cannot create a group filter because all filters for these visual types are row-level filters. If you are using the dashboard filters sidebar, the Group tab is not available. The Saved tab shows saved filters that you can apply to a dashboard, visual, or filter snippet. See Save and Maintain Filters.
-
On the Row tab, select the numeric field you want to use from the list of available number fields. A Select Values work area opens that you can use to select values and define this filter’s specifics. See the table below for available options.
Tab Description Range Select a relational comparison operator in the Operator selection box. Data is included in the visual when the data in the filter field meets the condition set by the relational operator and the numeric values you specify. Valid numeric operators are described in Operators.
The Range tab initially shows the full range of values available. It provides an Operator selection box and From and To boxes for you to use to select the range of values. Use the arrows in the From and To boxes to increase and decrease the maximum and minimum values.Keyset The Keyset tab allows you to select a keyset to apply as the filter (see Use Keysets). You can also select the add icon to access the Derived Field Editor or the Custom Metrics Editor to create or modify derived fields and custom metrics to be used as filters. See Access the Derived Field Editor from the Filters Sidebar and Access the Custom Metrics Editor from the Filters Sidebar. -
After you have defined the filter specifics, select Continue. After confirming your changes, select Apply.
- Filters you create at the dashboard level are applied to all the visuals in the dashboard that use that source.
- Filters you create at the visual level apply only to the selected (active) visual.
Optionally, nest multiple filters for more targeted filtering results. Select Nest Filters, then link multiple filters using
AND and OR filtering.Additional Numeric Field Filters in a Filter Snippet
When you create a new filter snippet, you define the initial data type, operator, data source, and value column to use in Data Settings. You can add additional filters, including nested filters, as needed.- Open your existing filter snippet.
- Select the Filters option from the Filter Snippet sidebar.
- Select Add Filter. An Add Filter work area opens to the Row tab, and includes Group and Saved tabs.
-
Select or create a field to filter from available options on the Row or Group tab.
- Select an existing available field from Attribute, Number, Time, or Hierarchy and define appropriate options to use.
- Alternatively, elect the add icon to add a derived field or custom metric, and define appropriate options to use.
- After you have defined the filter specifics, select Continue. After confirming your changes, select Apply.
Optionally, nest multiple filters for more targeted filtering results. Select Nest Filters, then link multiple filters using
AND and OR filtering.Set a Time Field Filter
When you select a time attribute for a visual or filter snippet, you can filter the time range you display.If you are using a field that has time zone information disabled (select Not Specified), only the time-related information is shown in the user interface and exported with your data. Time zone labels are not included.
Set a Time Range for a Time Field Filter in a Visual or Dashboard
-
Select the filter icon on the visual or dashboard to access the appropriate filter sidebar.
- To access the filter sidebar, select its filter icon or selectSettings from the Show More menu and then select the filter icon on the sidebar menu.
- To access the dashboard filter sidebar, select its filter icon . The dashboard-level filter icon is available only when all the visuals are from the same data source.
- To access the filter sidebar, select its filter icon
- SelectAdd Filter. An Add Filter work area opens to the Row tab, and includes Group and Saved tabs.
- Select the Row tab. If the style of your visual is an arc gauge, KPI chart, table (raw data), histogram, or map markers chart, the Group tab is available, but you cannot create a group filter because all filters for these visual types are row-level filters. If you are using the dashboard filters sidebar, the Group tab is not available. The Saved tab shows saved filters that you can apply to a dashboard or visual. See Save and Maintain Filters.
- On the Row tab, select a time field you want to use from the list of available time fields. A Select Values work area opens that you can use to select values and define this filter’s specifics on Range and Keysets tabs.
-
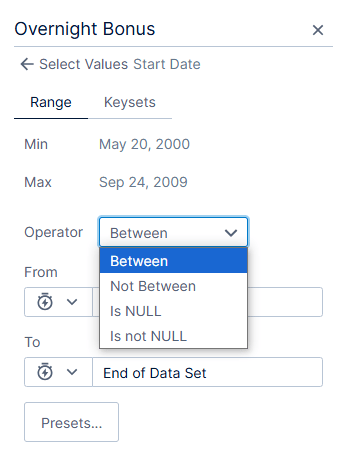
On the Range tab, you can optionally apply a null filter to the full time range. Select an Operator option as needed:
- Apply
Betweento specify a time range - Apply
Not Betweento exclude a specified time range - Apply
Is NULLto include only null values - Apply
Is not NULLto hide null values
- Apply
-
If you did not apply a
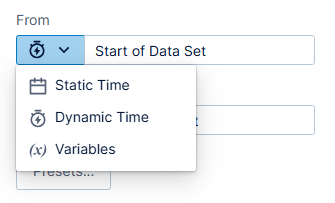
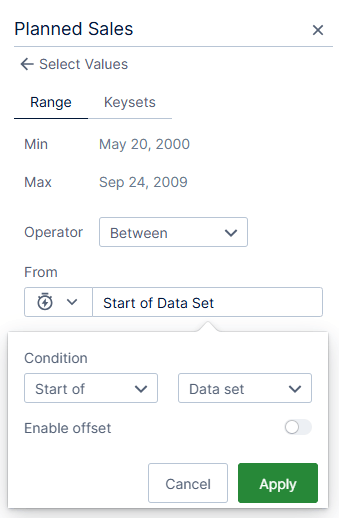
Nullfilter, you can use theFrom andTo boxes to specify the time range for the filter. You can set the range in static time, dynamic time, use variables, or use preset ranges provided.-
SelectStatic Time,Dynamic Time, orVariables in the drop-down menu.
-
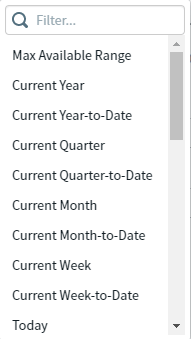
Alternatively, selectPresets to fill theFrom andTo boxes with predefined time ranges provided.
-
SelectStatic Time,Dynamic Time, orVariables in the drop-down menu.
- Alternatively, select a keyset on the Keysets tab to use for the filter. See Use Keysets.
-
After you have defined the filter specifics, selectContinue. After confirming your changes, selectApply.
- Filters you create at the dashboard level are applied to all the visuals in the dashboard that use that source.
- Filters you create at the visual level apply only to the selected (active) visual.
Optionally, nest multiple filters for more targeted filtering results. Select Nest Filters, then link multiple filters using
AND and OR filtering.Additional Time Field Filters in a Filter Snippet
When you create a new filter snippet, you define the initial data type, operator, data source, and value column to use in Data Settings. You can add additional filters, including nested filters, as needed.- Open your existing filter snippet.
- Select the Filters option from the Filter Snippet sidebar.
- Select Add Filter. An Add Filter work area opens to the Row tab, and includes Group and Saved tabs.
-
Select or create a field to filter from available options on the Row or Group tab.
- Select an existing available field from Attribute, Number, Time, or Hierarchy and define appropriate options to use.
- Alternatively, elect the add icon to add a derived field or custom metric, and define appropriate options to use.
- After you have defined the filter specifics, select Continue. After confirming your changes, select Apply.
Optionally, nest multiple filters for more targeted filtering results. Select Nest Filters, then link multiple filters using
AND and OR filtering.Filter by Hierarchy Field
You can filter your data by the values in a hierarchy field. The source used by the visual, visuals, dashboard (when only one source is in use) or associated filter snippet must be set up to include a hierarchy field. See Hierarchical Fields and Structures.Filter in a Visual or Dashboard
-
Select the filter icon on the visual or dashboard to access the appropriate filter sidebar.
- To access the filter sidebar, select its filter icon or select Settings from the Show More menu and then select the filter icon on the sidebar menu.
- To access the dashboard filter sidebar, select its filter icon . The dashboard-level filter icon is available only when all the visuals are from the same data source.
- To access the filter sidebar, select its filter icon
- Select Add Filter. An Add Filter work area opens to the Row tab, and includes Group and Saved tabs.
- On the Row tab, select an available hierarchy field to use to filter your data. A Select Values work area opens.
-
Select a filter Operator for your data.
- When you select Include, you can individually select hierarchical values in the filter to be included. This allows exclusion of specific descendent data from a parent as needed.
- When you select Equals or Descendents of, you can select groups of data quickly and easily; select a top level node and all of its descendents are included by default.
-
Select one or more nodes to filter your data. At least one filter value is required.
- Use the Search box to find specific nodes.
- Select the node indicators to expand and collapse nodes, or select and deselect Expand All to expand and collapse all nodes.
-
After you have defined your filter specifics, select Continue.
- If you create the filter at the dashboard level, it is applied to all the visuals and filter snippets in the dashboard.
- Otherwise, it is applied only to the selected (active) visual or filter snippet. After confirming your changes, select Apply.
Create a Filter Snippet - Hierarchy Data Type
- Create a new filter snippet.
- Define the Data Settings to use a Data Type of Hierarchy.
-
Select an Operator for your data.
- When you select Include, you and your users can individually select hierarchical values in the filter to be included. This allows exclusion of specific descendent data from a parent as needed.
- When you select Equals or Descendents of, you and your users can select groups of data quickly and easily; select a top level node and all of its descendents are included by default.
- Select an available Source. Any visuals in this dashboard that use this source can be affected by this filter snippet.
- Select an available Value Column, then select Apply.
- Your filter snippet updates, allowing users to filter data for widgets you connect to this filter snippet.
- Use the Search box to find specific nodes.
- Select and deselect Expand All to expand and collapse all nodes.
- Select the node indicators to expand and collapse individual nodes and their descendents.
Additional Hierarchy Filters in a Filter Snippet
When you create a new filter snippet, you define the initial data type, operator, data source, and value column to use in Data Settings. You can add additional filters, including nested filters, as needed.- Open your existing filter snippet.
- Select the Filters option from the Filter Snippet sidebar.
- Select Add Filter. An Add Filter work area opens to the Row tab, and includes Group and Saved tabs.
-
Select or create a field to filter from available options on the Row or Group tab.
- Select an existing available field from Attribute, Number, Time, or Hierarchy and define appropriate options to use.
- Alternatively, elect the add icon to add a derived field or custom metric, and define appropriate options to use.
- After you have defined the filter specifics, select Continue. After confirming your changes, select Apply.
Optionally, nest multiple filters for more targeted filtering results. Select Nest Filters, then link multiple filters using
AND and OR filtering.Apply Wildcard Filters to a Visual, Filter Snippet, or Dashboard
Wildcard filters are row-level filters you can use to filter the data on your dashboard visuals or filter snippets. Wildcard filters allow you to filter and analyze the data that matches specific combinations of character patterns.When working with multiple filter types on the same visual, row-level filters (including wildcard filters) are applied first to a visual, keyset filters are applied second, and group filters are applied last on the aggregated result set.
See Wildcard Case-Insensitive Filters and Wildcard Case-Sensitive Filters to determine whether case-insensitive or case-sensitive wildcards are supported.
Apply a wildcard filter
-
Select the filter icon on the visual, filter snippet, or dashboard to access the appropriate filter sidebar.
-
To access the filter sidebar, select its filter icon or select Settings from the menu and then select on the sidebar menu.
-
To access the dashboard filter sidebar, select its filter icon . The dashboard-level filter icon is available only when all the visuals are from the same data source.
-
To access the filter sidebar, select its filter icon
- Select the Row tab. If the style of your visual is an arc gauge, KPI chart, table (raw data), histogram, or map markers chart, the Group tab is available, but you cannot create a group filter because all filters for these visual types are row-level filters. If you are using the dashboard filters sidebar, the Group tab is not available. The Saved tab shows saved filters that you can apply to a dashboard, visual, or filter snippet. See Save and Maintain Filters.
-
On the Row tab, select the filter attribute you want to use from the list of available attributes. A second page with three tabs appears in the Filters sidebar.
- The Value tab allows you to select a filter value for the attribute. See Apply Row-Level Filters for instructions on using a regular row-level filter.
- The Wildcard tab allows you to specify a wildcard filter for the attribute. Continue following the steps in these instructions.
- The Keyset tab allows you to select a keyset filter for the attribute. See Use Keysets for instructions on using keysets in a filter.
to access the Derived Field Editor or the Custom Metrics Editor to create or modify derived fields and custom metrics to be used as filters. See Access the Derived Field Editor from the Filters Sidebar and Access the Custom Metrics Editor from the Filters Sidebar.
- Select the Wildcard tab to create a row-level wildcard filter.
-
Select an operator from the drop-down menu for the Operator box on the Wildcard tab.
- In the Value box, type a string of characters that represents the wildcard string for the filter. Data is included in the visual when the data in the filter field meets the condition set by this operator and the wildcard string you specify.
- By default the Case Sensitive slider is on (selected). When this option is selected, the wildcard filter includes data in the visual only if the filter attribute data exactly matches both the value of the wildcard string and the case of the wildcard string value. Slide the option off if you do not care if the visual data exactly matches the case of the wildcard string.
-
If you want to specify another wildcard value, select the add icon next to the Values title on the Wildcard tab. Then repeat Steps 5-7 above for the new wildcard value. Multiple wildcard values are treated as OR operations. A record can meet the filter criteria specified by any of the wildcard values to be selected for filter processing.
- Select Apply. If you create the filter at the dashboard level, it is applied to all the visuals in the dashboard. Otherwise, it is applied only to the selected (active) visual.
- Optionally, repeat these steps to apply additional filters to the visual or dashboard.
Control Filter Dialog Values
You can control the behavior of filter dialogs by data source. These controls are set in the Fields tab of the data source.- For attribute fields, you can require your users to manually enter attribute values to include in the visual or dashboard, instead of letting them select values from a list. See Control Attribute Field Filters.
- For number fields, you can specify the initial (default) minimum and maximum values available for selection as filters. See Control Number Field Filters.
- For time fields, you can specify the initial (default) minimum and maximum dates and times for the filter or, when shown on the time bar, the initial (default) time range shown. You can change these settings by manipulating the filters and time bar on the visual. See Control Time Field Filters.
In this release, when your admin enables the Enhanced Experience user interface, you will see changes to workflows you may have used in previous releases. If you are running an earlier release or your admin has not enabled the new interface, see Filters in Earlier Releases .
Control Attribute Field Filters
Control attribute field filters- Edit the data source for which you want to control attribute field filters. See Edit a Data Source.
- Select the Output in your source, then Expand View of the Fields tab to access the Filter Values panel.
- Locate your field (Data Type: Attribute) and select it.
- Select (check) Only Allow Custom Values in the sidebar menu.
- When your changes are complete, select Save.
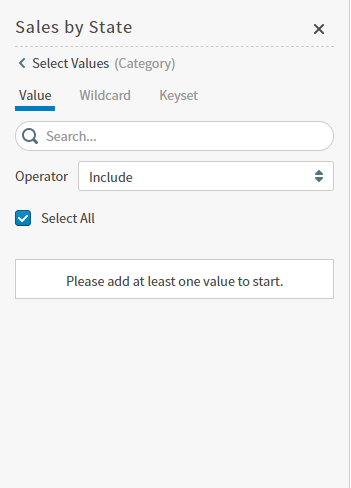
- Select Include or Exclude using the drop-down menu in the Operator box.
-
Type a value into the search box and select the add icon . Be sure to specify the values using the proper sentence case. For example, if the values are stored in lowercase letters only, but you enter a value with starting a capital letter, the search will not work.
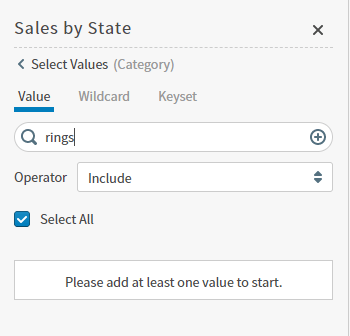
-
The value is added to the list of selected values.
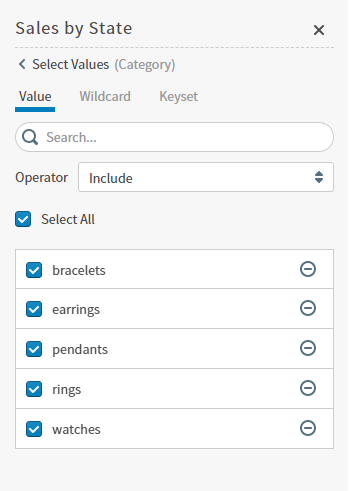
- When you are finished setting your filter values, select Continue and examine your updates. If they are correct, select Apply. For more information about setting attribute filters, see Attribute Filters.
Control Number Field Filters
Control number field filters- Edit the data source for which you want to control number field filters. See Edit a Data Source.
- Select the Output in your source, then Expand View of the Fields tab to access the Filter Values panel.
- Locate your field (Data Type: Number) and select it.
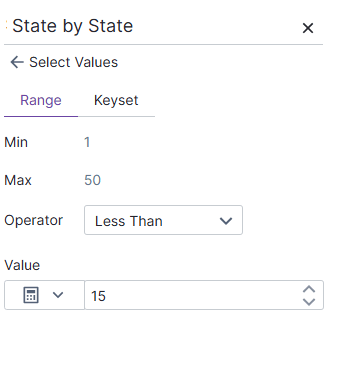
- Select to enable Custom Range in the Filter Values panel.
-
Specify minimum and maximum values for the filter ranges for the field. You can type the numbers directly in the Min and Max boxes or use the arrows in the boxes to increment and decrement the values.
Custom range values can be numbers or numbers with scientific notation.
- Select Save to apply the custom filter range.
If a Custom Range has been defined for a field, the minimum and maximum fields used in filters remain unchanged when you refresh source data. These fields are shown with cache actions disabled on the Cache tab.
Control Time Field Filters
Control the default time field filter and time bar ranges- Edit the data source for which you want to control time field filters. See Edit a Data Source.
- Select the Output in your source, then Expand View of the Fields tab to access the Filter Values panel.
- Locate your field (Data Type: Time) and select it.
- Change Source of Filter Values to Static Override to enable Custom Range in the Filter Values panel.
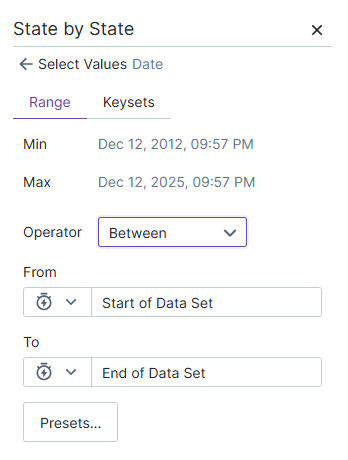
-
Specify minimum and maximum values for the filter ranges for the time field in the From and To boxes.
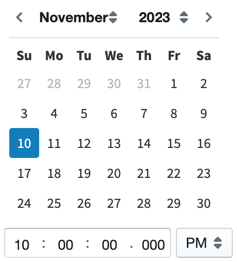
Select the value in the From or To time fields to select a new date and time in the resulting calendar pop-up.
- Select Save to apply the custom filter range.
If a Custom Range has been defined for a field, the minimum and maximum fields used in filters remain unchanged when you refresh source data. These fields are shown with cache actions disabled on the Cache tab.
Filters in Earlier Releases
You can control the behavior of filter dialogs by data source. These controls are set on the Fields tab of the data source configuration.- For attribute fields, you can require your users to manually enter attribute values to include in the visual or dashboard, instead of letting them select values from a list. See Controlling Attribute Field Filters.
- For number fields, you can specify the initial (default) minimum and maximum values available for selection as filters. See Controlling Number Field Filters.
- For time fields, you can specify the initial (default) minimum and maximum dates and times for the filter or, when shown on the time bar, the initial (default) time range shown. You can change these settings by manipulating the filters and time bar on the visual. See Controlling Time Field Filters.
Controlling Attribute Field Filters
Control attribute field filters- Edit the data source configuration for which you want to control attribute field filters. See Edit a Data Source.
- Select the Fields tab in the data source work area.
- Locate the attribute field in the field table on the Fields tab.
- Select (check) Only Allow Custom Values in the sidebar menu.
- When your changes are complete, select Save.
- Select Include or Exclude using the drop-down menu in the Operator box.
-
Type a value into the search box and select the add icon . Be sure to specify the values using the proper sentence case. For example, if the values are stored in lowercase letters only, but you enter a value with starting a capital letter, the search will not work.
-
The value is added to the list of selected values.
- When you are finished setting your filter values, select Continue and examine your updates. If they are correct, select Apply. For more information about setting attribute filters, see Attribute Filters.
Controlling Number Field Filters
Control number field filters- Edit the data source configuration for which you want to control number field filters. See Edit a Data Source.
- Select the Fields tab in the data source creation work area.
- Locate the number field in the field table on the Fields tab.
- Select to enable Custom Range in the sidebar menu.
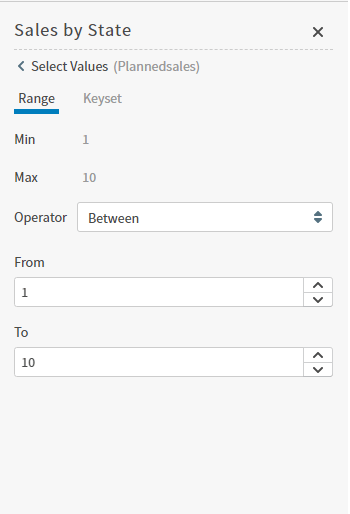
- Specify minimum and maximum values for the filter ranges for the field. You can type the numbers directly in the From and To boxes or use the arrows in the boxes to increment and decrement the values. Custom range values can be numbers or numbers with scientific notation.
- Select Save to apply the custom filter range.
If a Custom Range has been defined for a field, the minimum and maximum fields used in filters remain unchanged when you refresh source data. These fields are shown with cache actions disabled on the Cache tab.
Controlling Time Field Filters
Control the default time field filter and time bar ranges- Edit the data source configuration for which you want to control time field filters. See Edit a Data Source.
- Select the Fields tab in the data source configuration.
- Locate the time field in the field table on the Fields tab.
- Select to enable Custom Range in the sidebar menu.
-
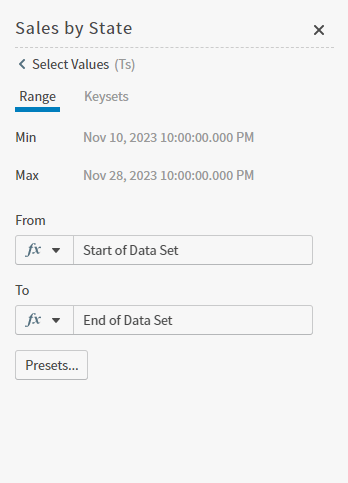
Specify minimum and maximum values for the filter ranges for the time field in the From and To boxes.
Select the value in the From or To time fields to select a new date and time in the resulting calendar pop-up.
- Select Save to apply the custom filter range.
If a Custom Range has been defined for a field, the minimum and maximum fields used in filters remain unchanged when you refresh source data. These fields are shown with cache actions disabled on the Cache tab.
Apply a Filter to Dashboard Visuals Using the Context Menu
You can filter visuals on a dashboard that use the same source or linked cross source simultaneously using the context menu of one of the visuals when the visuals are subscribed to the links. These filters are cross-visual filters. See Subscribe a Visual to a Link for more information about subscribing to dashboard links.Unlike row-level filters, cross-visual filters are not saved with the visual.
- You have a bar chart, pie chart, and table that show data from the same product sales data source (same source link) and are all subscribed to the same source link. In this scenario, you can use the context menu to simultaneously filter the data in two of the three visuals by any field in the data source. The visual you use to select the filter is not affected.
- You add a donut chart to the three visuals above in the same dashboard, but the donut chart uses data from a different sales data source. Cross-source link the two data sources by a field (for example, State) to subscribe all of the visuals to the cross-source link. When you use the context menu to filter one of the visuals by State, the subscribed visuals are all filtered. The visual you use to select the filter is not affected.
Apply A Context Menu Filter
Apply a context menu filter to all dashboard visuals that subscribe to a same source or cross-source link- Open the dashboard and select one of the data points in one of the visuals. The context menu appears.
- Select Filter on the context menu. The filter is applied to all of the visuals subscribed to the link. The visual you use to select the filter is not affected. The Filter option on the context menu is only available when the visual publishes a link for the field it is also using for its visual grouping. It is not available if the published cross-visual links for the visual are muted. See Mute a Published Link.
Filters and Time Bar Interaction
Using the filters and the time bar, you can examine your data in different dimensions. You can add time attributes when you create a new filter and control the filter from the time bar. This allows you to narrow the scope of the data by time. You can also set a filter directly in the time bar. Filters applied in the Filters menu override any filters you set in the time bar. The filters you create and the time bar actions you set influence the data shown on your visual. Depending on the filter settings and how they interact, it is possible that the combined results return no data. This is because the time filters that you set and the filters in the time bar are mutually exclusive. As a result, there is no data to display, so the intersection of the two time filters produces no result.Display All Unique Elements for a Selected Filter Panel Attribute
Resolution
The reason that only some, and not all, of the available attribute elements are showing on the filter panel is due to how Self-Service Analytics samples the data by default during the initial source creation. To have the filter panel populate with all the field elements, please refresh the field from within the data source so all the data is sampled. To do this:- Ensure you are logged into Self-Service Analytics as an administrator.
- Select the Source card on your home page or Data Sources from the main menu. The Sources page appears.
- Scroll down the list of connected data sources, select the target source and navigate to the Fields page.
- Scroll to the field on which the filter is being applied.
- Under the Statistics column, select the Refresh button. This ensures that all the values for that specific field will appear on the filter panel of the visuals or filter snippet.