
displays a warning icon if you try to create a conditional formatting rule for tables that include a field or group not present in the visual. The resulting rule will not include the missing field or group.
- Configure Conditional Formatting
- Using the Conditional Formatting Sidebar - Tables
- Using the Conditional Formatting Sidebar - Pivot Tables
- How Self-Service Analytics Applies Formatting Rules
How Self-Service Analytics Applies Formatting Rules
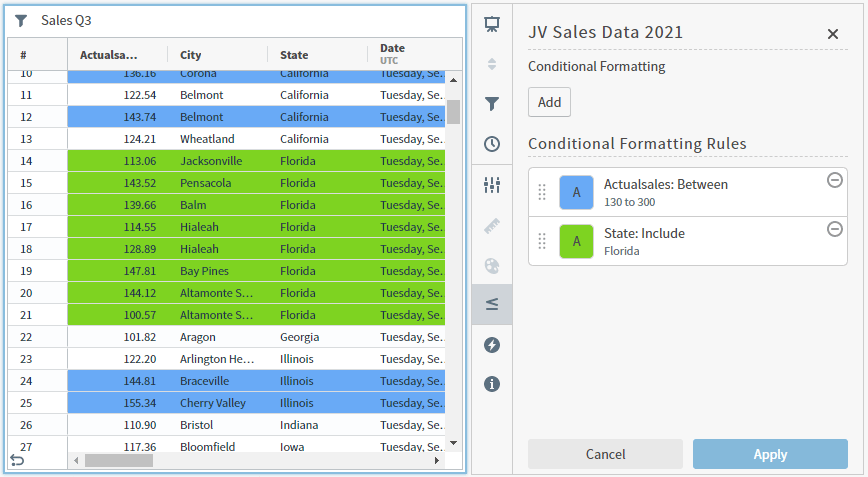
You can apply formatting rules to data affected by multiple conditions. The formatting rules are applied sequentially, and can cancel out a previously applied rule. For example, if you define the background row color for orders from Florida to appear green, but define the background row color for orders that fall within a certain threshold to appear blue, the final result will depend on the order in which you organize your format rules.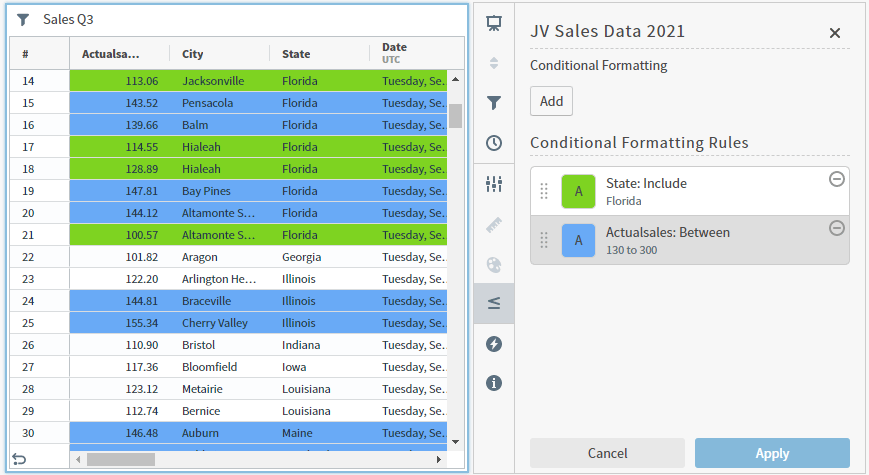
Using the Conditional Formatting Sidebar - Tables
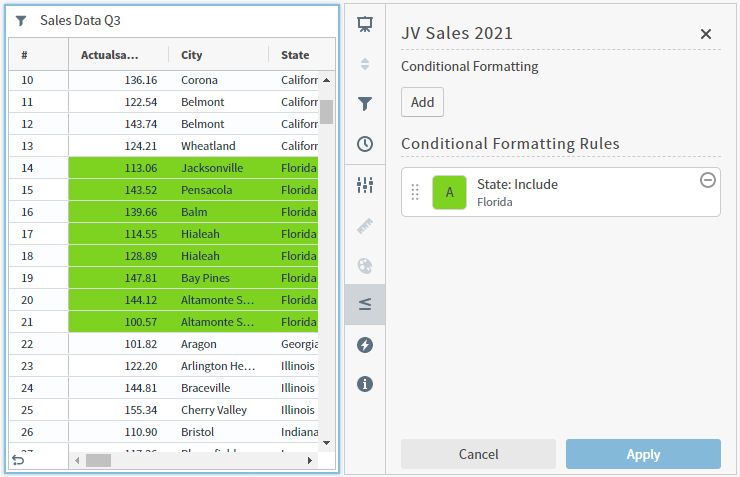
Format your visuals by adding color and text formats based on the conditions you define. A sidebar menu work area, Conditional Formatting, allows you to set format conditions to apply to your data.displays a warning icon if you try to create a conditional formatting rule for tables that include a field or group not present in the visual. The resulting rule will not include the missing field or group.
- Select the visual in the Visual Gallery, a self service report, or on a dashboard. Open the sidebar menu.
-
Select the conditional formatting option
 . The Conditional Formatting sidebar opens.
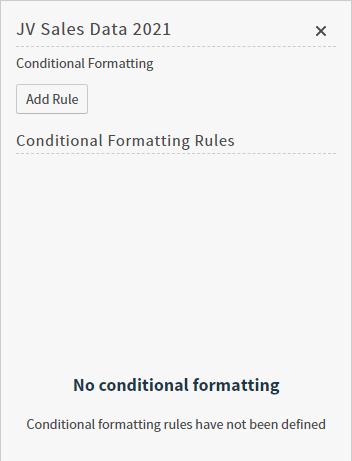
- Use this work area to configure formatting options for your table visuals or the table visual of a self service report.
- After making changes, select Apply to apply the conditional formatting rules you have specified.
- Save the visual, self service report, or dashboard to save your changes.
Conditional Format Options
The available options for rules and formatting change to reflect your selections.Conditional Formatting Sidebar
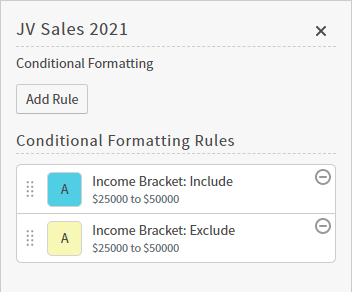
- Select Add Rule to add a conditional formatting rule.
- Select an existing rule to edit the rule, or the delete icon
 to delete the rule.
 - Select and drag rules to change their order.
Add or Edit Conditional Formatting Rule
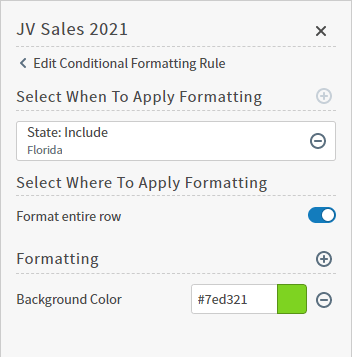
Select When To Apply Formatting
Select the add icon in Select When To Apply Formatting to define the conditions to apply your formatting.
Select Where To Apply Formatting
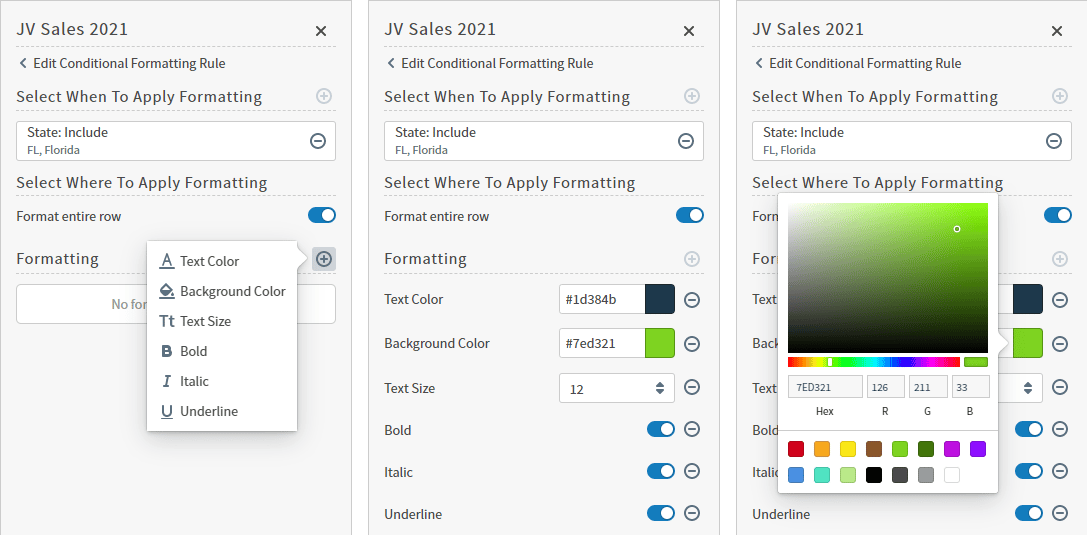
Enable Format entire row in Select Where To Apply Formattingto format the entire row. Disable to format only the applicable cell. Select the add icon for Formatting to define the formatting for your condition.
Select the delete icon to delete a formatting option.
Select When To Apply Formatting
-
Row attribute: Select a row attribute to define the values for formatting by this data. Optionally, select the add icon to add a derived field or custom metric.
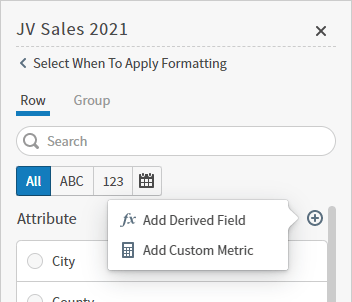
-
Group attribute: Select an attribute that you’ve grouped your data by to define values for that aggregated data. Optionally, select the add icon to add a derived field or custom metric.
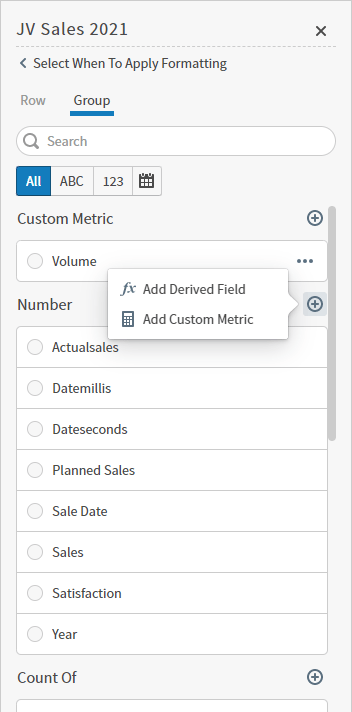
Sumof Actualsales grouped by ProductBetweena defined range of values.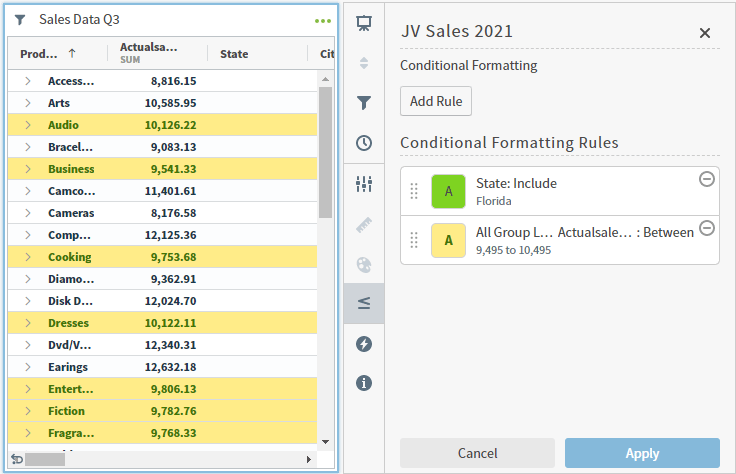
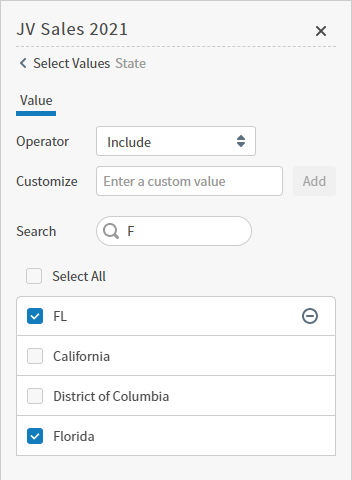
Select Values for an Attribute
| Selection | Description |
|---|---|
| Operator | Select Include to include the selected values for this attribute. Select Exclude to exclude the selected values for this attribute. |
| Customize | Enter a custom value and select Add to add it to the values list. Select the delete icon to remove it from the values list. |
| Search | Search for specific values in your list. |
| Select All | Select the checkbox to include all listed values. Clear the checkbox to remove all selected values. |
Select Values for a Number
| Selection | Description |
|---|---|
| Range | Displays the range for this value. |
| Operator | Select an operator to use. Options may include Between, Not Between, Equal, Not Equal, Greater Than, Greater Than or Equal, Less Than, Less than or Equal, Include, and Exclude. Depending on the Operator you select, different definition fields are available to use. |
| From, To | Define a value range for Betweenand Not Between. |
| Value | Define a value for Equal, Not Equal, Greater Than, Greater Than or Equal, Less Than, and Less than or Equal. |
| Customize | Optionally define for Include, and Exclude. Enter a custom value and select Add to add it to the values list. Select the delete icon to remove it from the values list. |
| Search | For Include, and Exclude. Search for specific values in your list. |
| Select All | Define for Include, and Exclude. Select the checkbox to include all listed values. Clear the checkbox to remove all selected values. |
Select Values for a Date
| Selection | Description |
|---|---|
| Range | Displays the range for this value. |
| Operator | Select an operator to use. Options may include Between, Is NULL, and Is not NULL. Depending on the Operator you select, different definition fields are available to use. |
| From, To | Define a value range for Between, using Static Time or Dynamic Time. See Set a Time Field Filter. |
| Presets … | Select an available Preset… for Between. See Set a Time Field Filter. |
Formatting
Select the add icon to add a formatting option you will apply to your condition. Select the delete icon to remove the formatting option.
| Format Option | Description |
|---|---|
| Text Color | Select to define the text color format to apply to your condition. Enter the color number in hexadecimal, or use the color picker to enter RGB values or pick your color visually. |
| Background Color | Select to define the background color to apply to your condition. Enter the color number in hexadecimal, or use the color picker to enter RGB values or pick your color visually. |
| Bold | Select to enable or disable bold formatting to apply to your condition. |
| Italic | Select to enable or disable italic formatting to apply to your condition. |
| Underline | Select to enable or disable underline formatting to apply to your condition. |
Using the Conditional Formatting Sidebar - Pivot Tables
Format your visuals by adding color and text formats based on the conditions you define. A sidebar menu work area, Conditional Formatting, allows you to set format conditions to apply to your data. You’re not limited to formatting information based on data represented in the table, you can create conditional formatting rules based on any data available in the source that is the basis of the pivot table.- Select the pivot table visual in the Visual Gallery or on a dashboard.
- If you selected the visual on a dashboard, select Settings on the visual drop-down menu to access the sidebar menu for the visual.
-
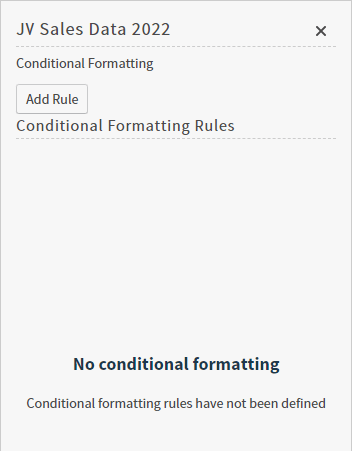
Select the conditional formatting option on the sidebar menu for the visual. The Conditional Formatting sidebar opens.
- Using the Conditional Formatting sidebar, you can configure formatting options for your pivot table visuals. See Configure Conditional Formatting.
- After making changes, select Apply to apply the conditional formatting rules you have specified.
- Save the visual or dashboard to save your changes.
Conditional Format Options
The available options for rules and formatting change to reflect your selections.Conditional Formatting Sidebar
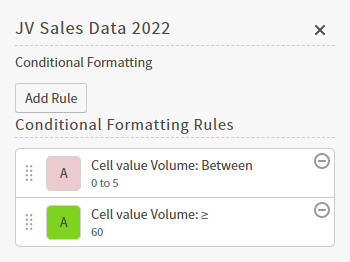
- Select Add Rule to add a conditional formatting rule. See Configure Conditional Formatting.
- Select an existing rule to edit the rule, or the delete icon to delete the rule.
- Select and drag rules to change their order.
Add or Edit Conditional Formatting Rule
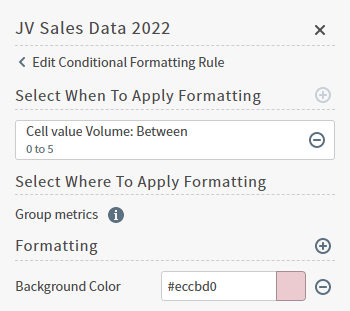
Select When To Apply Formatting
Select the add icon in Select When To Apply Formatting to define the conditions to apply your formatting.
Select Where To Apply Formatting
Select the add icon for Formatting to define the formatting for your condition.
Select the delete icon to delete a formatting option.
Select When To Apply Formatting
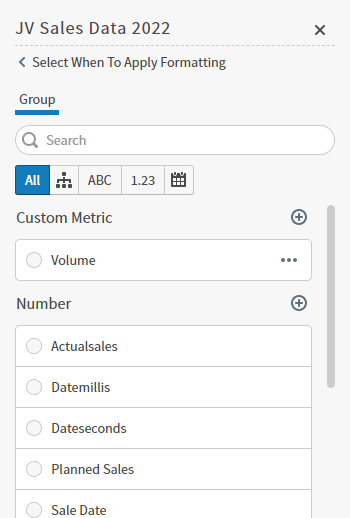
Group attribute: Select a group of data to define values for that aggregated data. Optionally, select the add icon to add a derived field or custom metric.
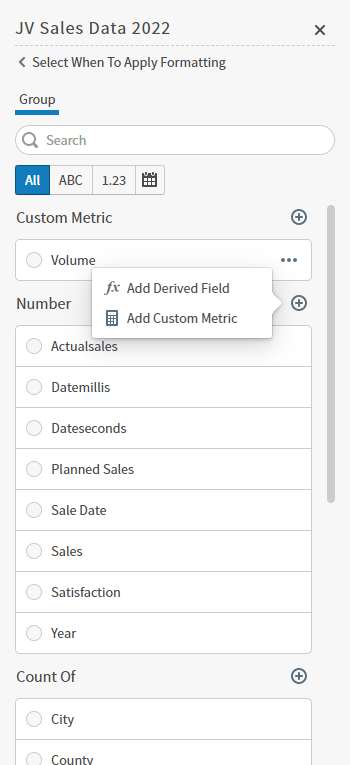
Range of Volume grouped by Income Bracket is Between a defined range of values.
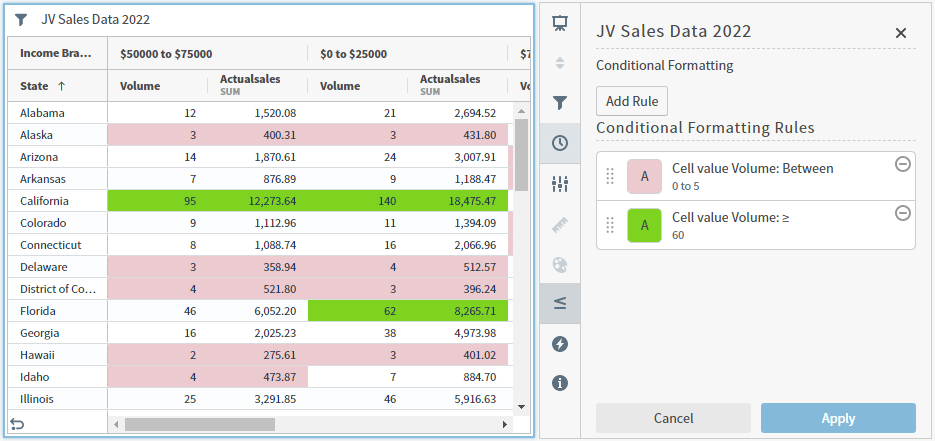
Select Values for a Custom Metric
| Selection | Description |
|---|---|
| Values | Select a range of values to format. Options include:
|
| Operator | Select an operator to use. Options may include Between, Equal, Not Equal, Greater Than, Greater Than or Equal, Less Than, and Less than or Equal. Depending on the Operator you select, different definition fields are available to use. |
| From, To | Define a value range for Between. |
| Value | Define a value for Equal, Not Equal, Greater Than, Greater Than or Equal, Less Than, and Less than or Equal. |
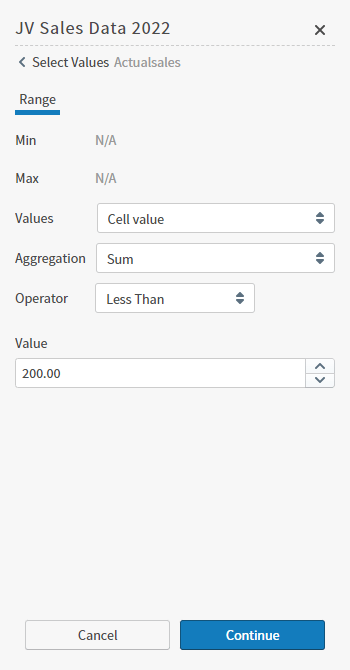
Select Values for a Number
| Selection | Description |
|---|---|
| Range | Displays the range for this value. |
| Values | Select a range of values to format. Options include:
|
| Aggregation | Select an aggregation option for Values. Options include Avg, Min, Max, Sum, Count, Distinct Count, and Last Value. |
| Operator | Select an operator to use. Options may include Between, Equal, Not Equal, Greater Than, Greater Than or Equal, Less Than, and Less than or Equal. Depending on the Operator you select, different definition fields are available to use. |
| From, To | Define a value range for Between. |
| Value | Define a value for Equal, Not Equal, Greater Than, Greater Than or Equal, Less Than, and Less than or Equal. |
Select Values for Count Of
| Selection | Description |
|---|---|
| Values | Select a range of values to format. Options include:
|
| Aggregation | Select an aggregation option for Values. Options include Countand Distinct Count. |
| Operator | Select an operator to use. Options may include Between, Equal, Not Equal, Greater Than, Greater Than or Equal, Less Than, and Less than or Equal. Depending on the Operator you select, different definition fields are available to use. |
| From, To | Define a value range for Between. |
| Value | Define a value for Equal, Not Equal, Greater Than, Greater Than or Equal, Less Than, and Less than or Equal. |
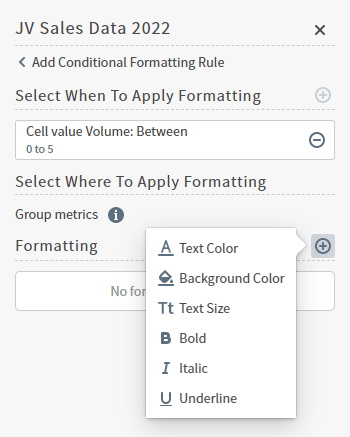
Formatting
Select the add icon to add a formatting option you will apply to your condition. Select the delete icon to remove the formatting option.
| Format Option | Description |
|---|---|
| Text Color | Select to define the text color format to apply to your condition. Enter the color number in hexadecimal, or use the color picker to enter RGB values or pick your color visually. |
| Background Color | Select to define the background color to apply to your condition. Enter the color number in hexadecimal, or use the color picker to enter RGB values or pick your color visually. |
| Bold | Select to enable or disable bold formatting to apply to your condition. |
| Italic | Select to enable or disable italic formatting to apply to your condition. |
| Underline | Select to enable or disable underline formatting to apply to your condition. |
Configure Conditional Formatting
Format your tabular visuals and self service reports by adding color and text formats based on the conditions you define. The Conditional Formatting sidebar allows you to set formatting based on conditions to apply to your data.Define Conditional Formatting for Table Visuals
- Select a table visual in a dashboard, a self service report, or the Visual Gallery.
-
Select the conditional formatting icon
 in the sidebar menu. The Conditional Formatting sidebar opens.
-
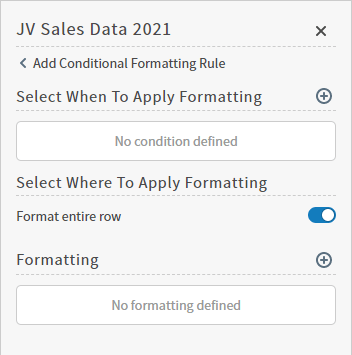
Select Add to open the add rule work area. Use this work area to define a condition and the formatting to apply.
-
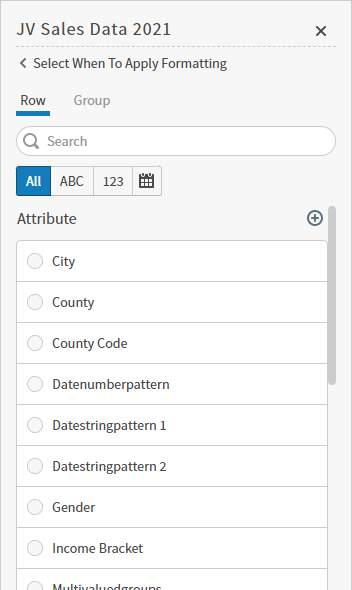
Select the add icon in Select When To Apply Formatting to define the conditions to apply your formatting. See Using the Conditional Formatting Sidebar - Tables.
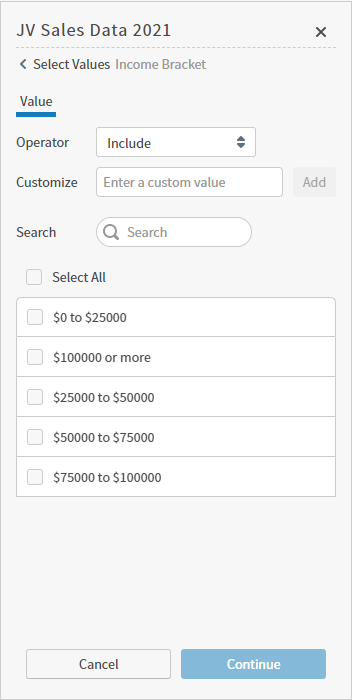
- Optionally, enable Format entire row in Select Where To Apply Formatting to format the entire row. Disable to format only the applicable cell.
-
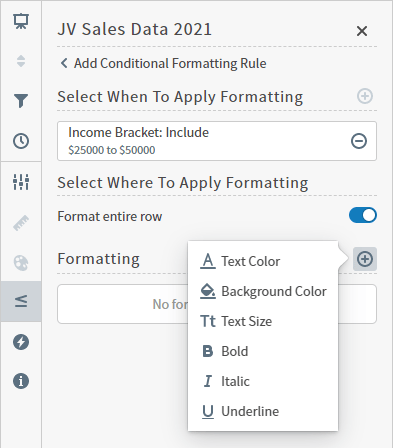
Select the add icon for Formatting to define the formatting to apply to data that matches the condition you set. See Use the Conditional Formatting Sidebar.
-
Optionally, add as many formatting options as you need. Formats are applied sequentially: see How Self-Service Analytics Applies Formatting Rules. Select the delete icon to remove any unneeded options. Select Continue to save your changes.
-
Optionally, add more conditional formatting rules. Drag and drop the rules change their order. In a case where multiple formatting rules apply to results of overlapping conditions, formats are applied sequentially. See Use the Conditional Formatting Sidebar.
- Select Apply to apply your changes to the visual.
Define Conditional Formatting for a Pivot Table Visual
- Select a table visual in a dashboard or in the Visual Gallery.
-
Select the conditional formatting icon in the sidebar menu. The Conditional Formatting sidebar opens.
-
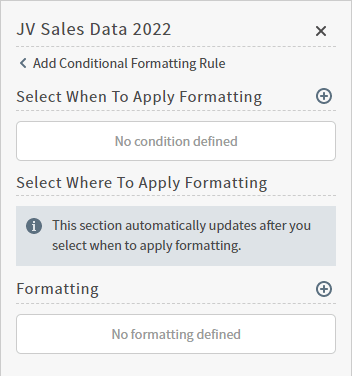
Select Add to open the add rule work area. Use this work area to define a condition and the formatting to apply.
-
Select the add icon in Select When To Apply Formatting to define the conditions to apply your formatting. See Using the Conditional Formatting Sidebar - Pivot Tables.
-
Select the add icon for Formatting to define the formatting to apply to data that matches the condition you set. See Use the Conditional Formatting Sidebar.
-
Optionally, add as many formatting options as you need. Formats are applied sequentially: see How Self-Service Analytics Applies Formatting Rules. Select the delete icon to remove any unneeded options. Select Continue to save your changes.
-
Optionally, add more conditional formatting rules. Drag and drop the rules change their order. In a case where multiple formatting rules apply to results of overlapping conditions, formats are applied sequentially. See Use the Conditional Formatting Sidebar.
- Select Apply to apply your changes to the visual.