
- Custom Metrics Editor
- Create and Modify Custom Metrics
- Supported Aggregation Functions
- Supported Row-Level Functions
- Apply Filters to Custom Metrics
- Delete Custom Metrics
- Custom Metric Examples
Create and Modify Custom Metrics
Custom metrics are created and modified using the Custom Metrics Editor. Create or modify a custom metric- Access the Custom Metrics Editor in any of the ways described in Custom Metrics Editor.
-
Enter a label for the custom metric in the space labeled Untitled Custom Metric.
If you are using non-Latin characters in your functions, the label for your custom metric should start with a letter or an underscore (_) symbol followed by one or more letters, numbers, underscore, or period characters. Symbols other than the underscore (_) or period (.) are not allowed.
-
Enter the expression for the custom metric in the editing space. Expressions should follow standard mathematical and logical syntax and are resolved using the standard order of operations. You can manually key in expressions or you can select the elements of your expressions from the menus at the left. The expression should not be assigned to a variable because the resolved value of the expression is assigned to the custom metric, which serves as the ‘variable’ to which the value is assigned. That is, enter
a / brather thanx = a / b. Row-level expressions and aggregate functions can be used in custom metrics. In addition, custom metrics can be filtered (using date and time filter aggregate functions and SQL-like expressions). - To test your custom metric, select Run. The editor attempts to calculate your custom metric. Any errors are reported. Any results are shown in the Preview area of the Custom Metrics Editor.
- When you are finished creating or modifying your custom metric definition, select Save.
Delete Custom Metrics
You can delete custom metrics from a data source in the Custom Metrics tab on the Fields tab, or by deleting the source entirely.If you try to delete a visual, filter snippet, dashboard, self service report, dashboard link, source, or source field, Self-Service Analytics displays an error message naming any objects dependent on the item you’re trying to delete. You can delete the item after you’ve removed the association from the dependent object. See Fields Usage.
- Edit the data source configuration in the UI. See Edit a Data Source.
- Select the Output node.
-
Select Custom Metrics to open the Custom Metrics tab.
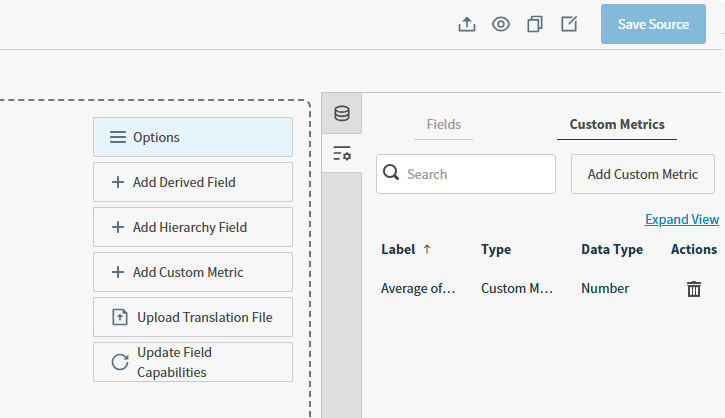
- Locate the custom metric in the Custom Metrics table that you would like to remove.
- Select the delete icon in the Actions column.
- Select Delete in the pop-up confirmation dialog. The custom metric is deleted if it is not in use.
Custom Metrics Editor
Self-Service Analytics provides a Custom Metrics Editor to help you create and test custom metrics for a data source. To define custom metrics for a data source, you must have:- Read permission for the data source and the Edit Calculations privilege, or
- Write permission for the data source.
Count(*) expression is created.
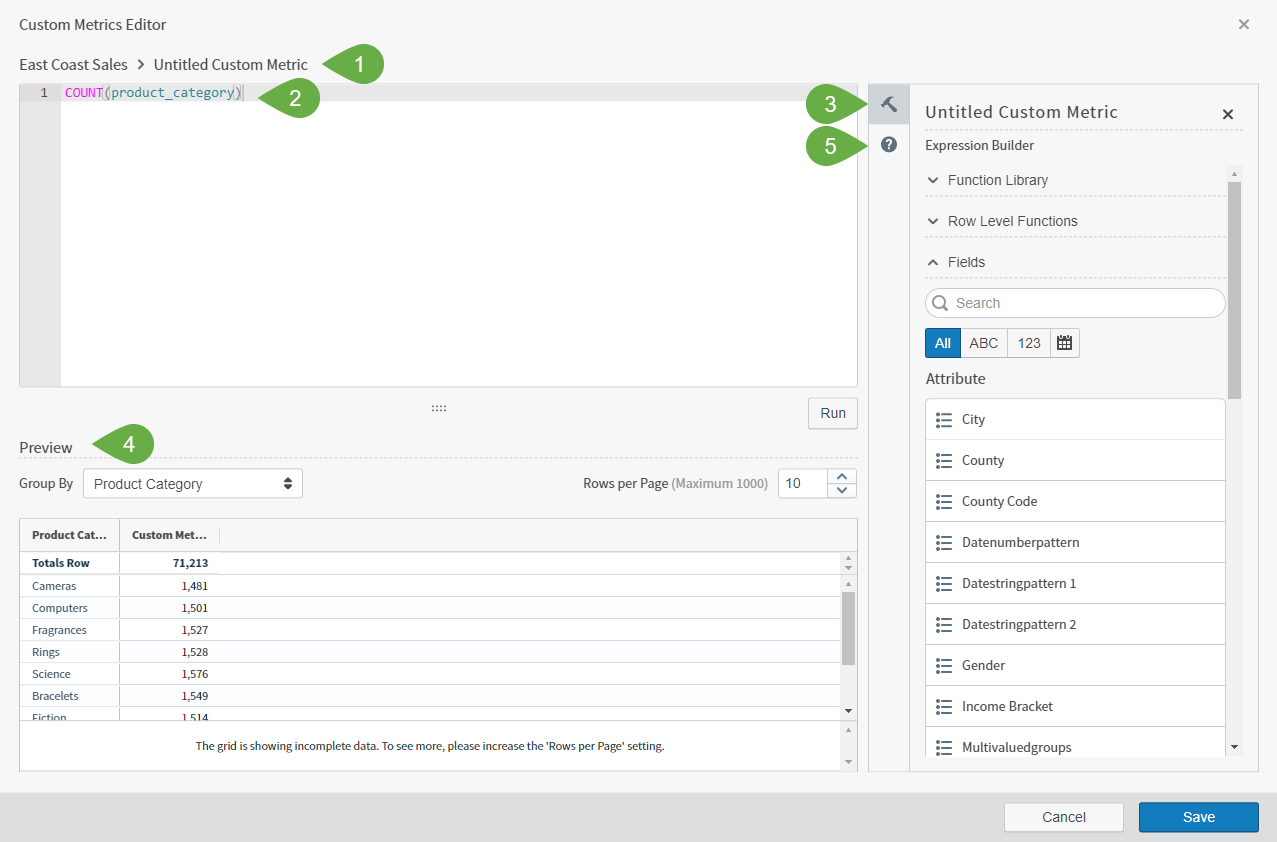
- Custom Metric Label: Mandatory, fewer than 255 characters long.
- Editing space: Build your expression in this space. Syntax highlighting improves the readability of your expression.
- Expression Builder work area: Includes a Function Library, Row Level Functions, and Fields to help you build your custom metric.
- Preview space: Shows a preview of the results of your expression.
- Calculation Help: Provides more detailed information about the types of metrics Self-Service Analytics supports.
-
Syntax highlighting improves the readability of your expressions to provide visual clues about the items being used and their validity.
Parts of an expression are highlighted in different colors or with different text treatments:
- function names, both row level and aggregate
- fields and metrics
- keywords such as CASE and IN
- example parameters
- date period constants such as
year - values such as numbers and
trueorfalse - strings
- arithmetic operators such as
+
- Limit the number of records shown in Preview by adjusting the Rows per Page.
- The Function Library, Row Level Functions and Fields sections always appear in the Expression Builder.
-
Autocomplete functionality is included: Type two letters and a list of possible auto-completions appears.
- Function completions provide the type of function, the name of the function, the description of the function, and an example of how the function is used, including parameters.
- Field completions are available by typing either the field ID or the field label. The field ID appears in square brackets next to the field label when the two are different. Field completions provide the type of the field, the field label and ID.
- Metric completions provide the metric label and the expression that will be inserted into the editor when the metric is selected.
- Syntax and validation errors are shown in the Preview area.
- When you’re creating or editing an expression, select Cancel to return your expression to the initial state.
- Self-Service Analytics disables the Save button, preventing you from saving a custom metric unless it has a successfully run expression.
-
When you close the editor with unsaved changes, Self-Service Analytics displays a confirmation message.
- Select Cancel to continue editing or changing the text of the label for your custom metric.
- Select Discard to discard your changes. If you are editing an existing item, your last saved version remains in Self-Service Analytics.
- If you select Discard while creating a new expression, Self-Service Analytics returns you to the source work area.
- Access the Custom Metrics Editor from a Data Source Configuration
- Access the Custom Metrics Editor from the Metric Selection Dialog
- Access the Custom Metrics Editor from the Group Selection Dialog
- Access the Custom Metrics Editor from the Color Sidebar
- Access the Custom Metrics Editor from the Filters Sidebar
Access the Custom Metrics Editor from the Color Sidebar
Access the Custom Metrics Editor from the Color sidebar of a visual-
Select
 and then Color from the visual drop-down menu to access the Color sidebar.
-
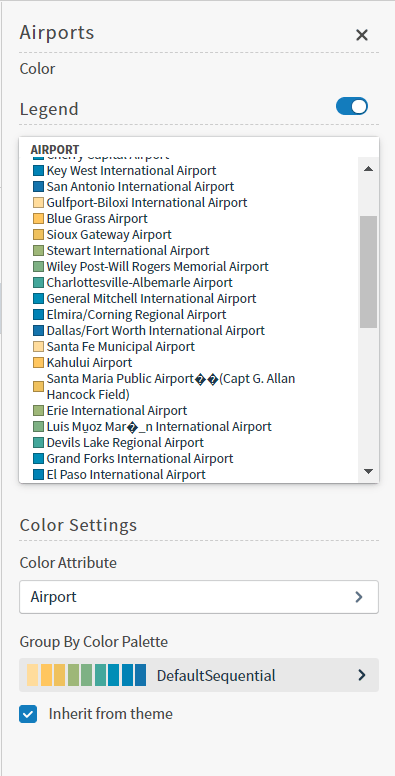
Select the Color Attribute box on the Color sidebar. A list of attribute, number, and time fields you can select for the color attribute appears in the Color sidebar.
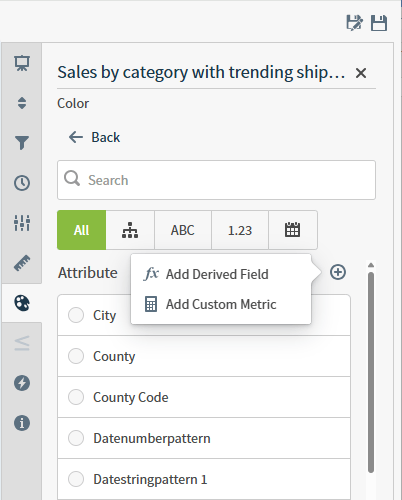
- Select the add button in the Attribute, Number, or Time fields section of the sidebar. A menu opens with two options: Add Derived Field and Add Custom Metric.
- Select Add Custom Metric to access the Custom Metrics Editor and create a custom metric.
Access the Custom Metrics Editor from the Filters Sidebar
Access the Custom Metrics Editor from the Filters sidebar of a visual or dashboard-
Access the visual filter sidebar or the dashboard filter sidebar.
- To access the visual filter sidebar, select the filter icon (
 ) on the visual or select
  on the sidebar menu. If the visual is in a dashboard, select Settings from the visual menu (), then select the filter icon on the sidebar menu.
 - To access the dashboard filter sidebar, select the dashboard filter icon (
 ) next to the dashboard title. The dashboard-level filter icon is available only when all the visuals are from the same data source.
- To access the visual filter sidebar, select the filter icon (
-
Select the add icon
 at the top of the Attribute, Number, or Time sections on the Row or Group tab. A menu opens with two options: Add Derived Field and Add Custom Metric.
- Select Add Custom Metric to access the Custom Metrics Editor and create a custom metric.
Access the Custom Metrics Editor from the Group Selection Dialog
Access the Custom Metrics Editor from the Group selection dialog of a visual-
On a visual, select the group label (x-axis label) to view the Group selection dialog.
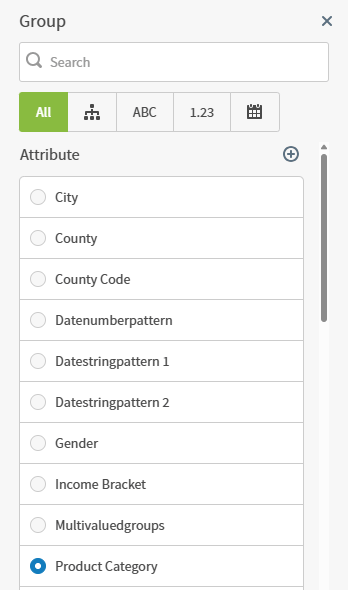
- Select the add button in the Attributes, Number or Time section of the dialog. A menu opens with two options: Add Derived Field and Add Custom Metric.
- Select Add Custom Metric to access the Custom Metrics Editor and create a custom metric.
Access the Custom Metrics Editor from the Metric Selection Dialog
Access the Custom Metrics Editor from the metric selection dialog of a visual-
On a visual, select the metric label (y-axis label) to view the Metric selection dialog.
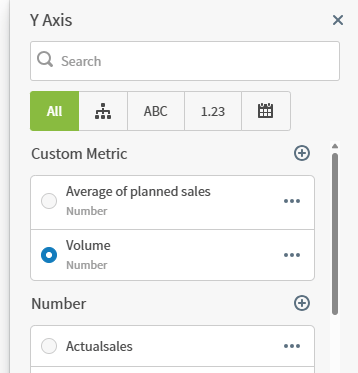
- Select the add icon in the Number or Custom Metric section of the dialog. A menu opens with two options: Add Derived Field and Add Custom Metric.
- Select Add Custom Metric to access the Custom Metrics Editor and create a custom metric.
- On a visual, select the metric label (y-axis label) to view the Metric selection dialog.
-
Locate a custom metric listed on the Metric selection dialog and select the ellipsis () next to it. The following menu appears:
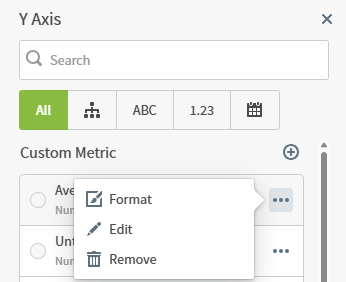
- Select Edit on the menu to edit the custom metric. The Custom Metrics Editor appears.
Access the Custom Metrics Editor from a Data Source Configuration
Access the Custom Metrics Editor from a data source configuration- Edit the data source configuration in the UI. See Edit a Data Source.
- Select the Output node.
-
Select Custom Metrics to open the Custom Metrics tab, and Expand View to open a larger work area.
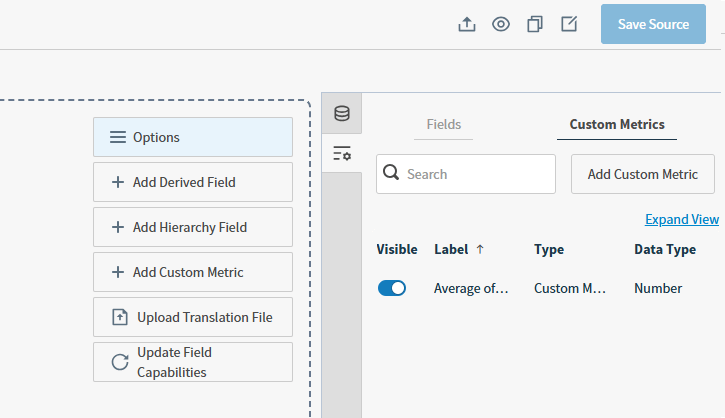
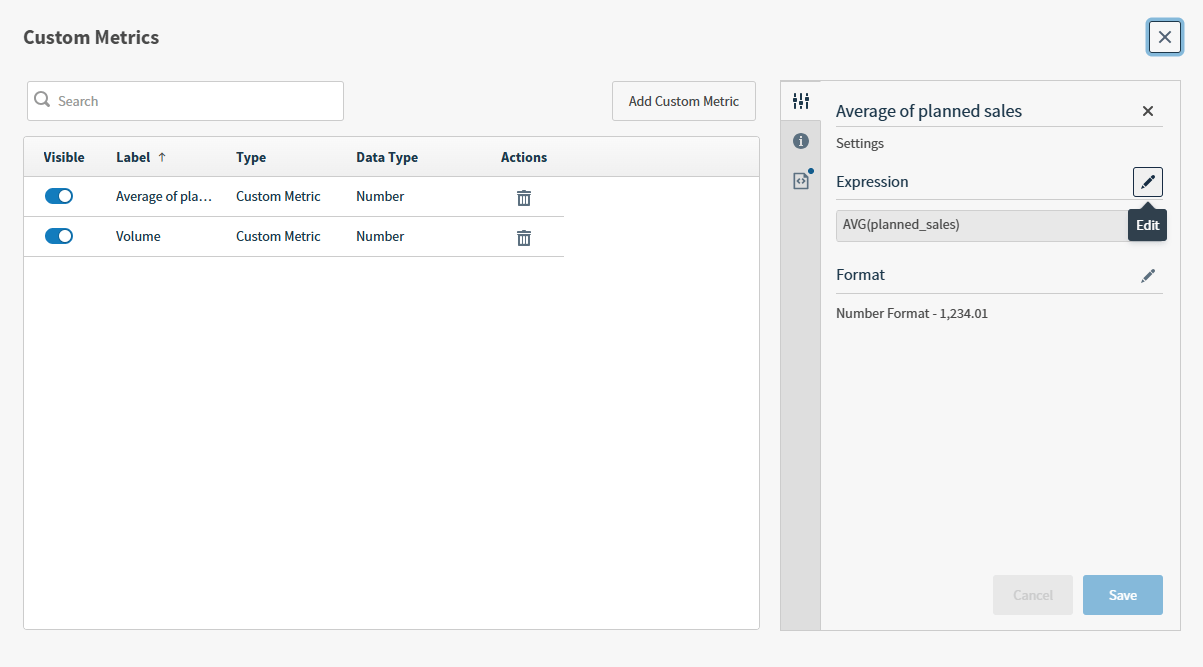
- Select Add Custom Metric to add a custom metric.
- Optionally, select an existing custom metric to modify the metric.
Custom Metric Examples
The following commonly used custom metrics demonstrate custom metric syntax. These examples work with your data source only if your data source contains fields of the same name and type. Change the fields to make them work with your data sources. The following custom metric is the sum of a metric (totallatearrivals) between a specific date (2018-01-01) and the current date:
totallatearrivalscan be replaced by your own metriceventdatecan be replaced by your own date attribute2018-01-01can be replaced by a different specific date
totallatearrivals) from the previous period:
totallatearrivalscan be replaced by your own metriceventdatecan be replaced by your own date attribute
totallatearrivals) and the sum of the same metric from the previous period:
totallatearrivalscan be replaced by your own metric
Apply Filters to Custom Metrics
You can apply filters to your custom metrics. This means that attributes from the data can be applied as filter parameters to further refine and narrow your results. Specifying a filter lets you perform a calculation within a predefined range, for example, determining sales results within a certain period of time or within a certain demographic. This topic covers the application of filters to custom metrics and provides instructions covering the operators and syntax for integrating a filter into your custom metrics.Filter Syntax
To create a custom metric that includes filters, operators or expressions are required. When integrating a filter within a custom metric, keep in mind that Self-Service Analytics supports certain operators and follows a logical structure. In general, creating a filtered custom metric entails selecting the appropriate function variable, integrating the desired attribute or metric, using the appropriate filter operators and Date function, and entering a date in the correct format. Self-Service Analytics custom metrics use one of the following general structures:-
<agg-function>is any of the aggregate functions described in Supported Aggregation Functions. -
WHERE or TRANSFORM is the appropriate SQL-like expression used for custom metric filtering. TRANSFORM is used specifically with the
PreviousPerioddate and time filter aggregation function. WHERE and TRANSFORM filters are always applied to the broadest possible expression. For example, the following two expressions are both valid, but the first applies the filters to both SUMs, while the second expression applies the filter only toSUM(Sales).WHERE clauses can include row-level functions and expressions. -
<field>is a field (metric or attribute) in the data. -
<operator>is one of the operators shown in the following table:Filters Capability Operators Notes Filtering on attribute options NULL check: IS NULL, IS NOT NULL
Single value: =, !=, STARTS WITH, ENDS WITH, CONTAINS
Multiple values: IN(), NOT IN()- Non-numeric fields such as Name, Address and State can be used as a filter.
- References to an attribute in a field must be enclosed in single quotation marks. For example:
- Values specified for STARTS WITH, ENDS WITH, and CONTAINS are case-sensitive. The following example would show sales for states that include the lowercase letters
ia, such as California and Louisiana (and others):
Filtering on date field options Date range operator: BETWEEN - Standard date formats (see Convert Attributes to Time Fields in Data Source Field Specifications) are supported (such as ‘yyyy-mm-dd’, ‘dd/mm/yyyy’ including ‘hh-mm-ss’) .
- Date (‘01-01-2015’) must be enclosed in single quotation marks.
- Supported time periods are YEAR, MONTH, WEEK, or DAY
Filtering on numeric fields and custom metric options >, <, =, != - References to a numeric field must be enclosed in single quotation marks
- References can be made to other custom metrics (using the custom metric label)
-
<value>is an appropriate value, based on the requirements of the SQL-like expression. Values can be specific numbers or dates, or one of the date and time filter aggregation functions.
Examples
The following table provides examples of filtered custom metrics.| Filtered Custom Metric Examples | |
|---|---|
| Capability | Example |
| Filtering on Attribute options | |
| Filtering on Date field options | |
| Filtering on numeric fields and custom metric options | To calculate year over year growth: |
| Comparing the difference between the current period to last period | Compare this period’s deliveries to last period’s deliveries: |
| Using a row-level expression or function in a filter | |