
In this release, when your admin enables the Enhanced Experience user interface, you will see changes to workflows you may have used in previous releases.
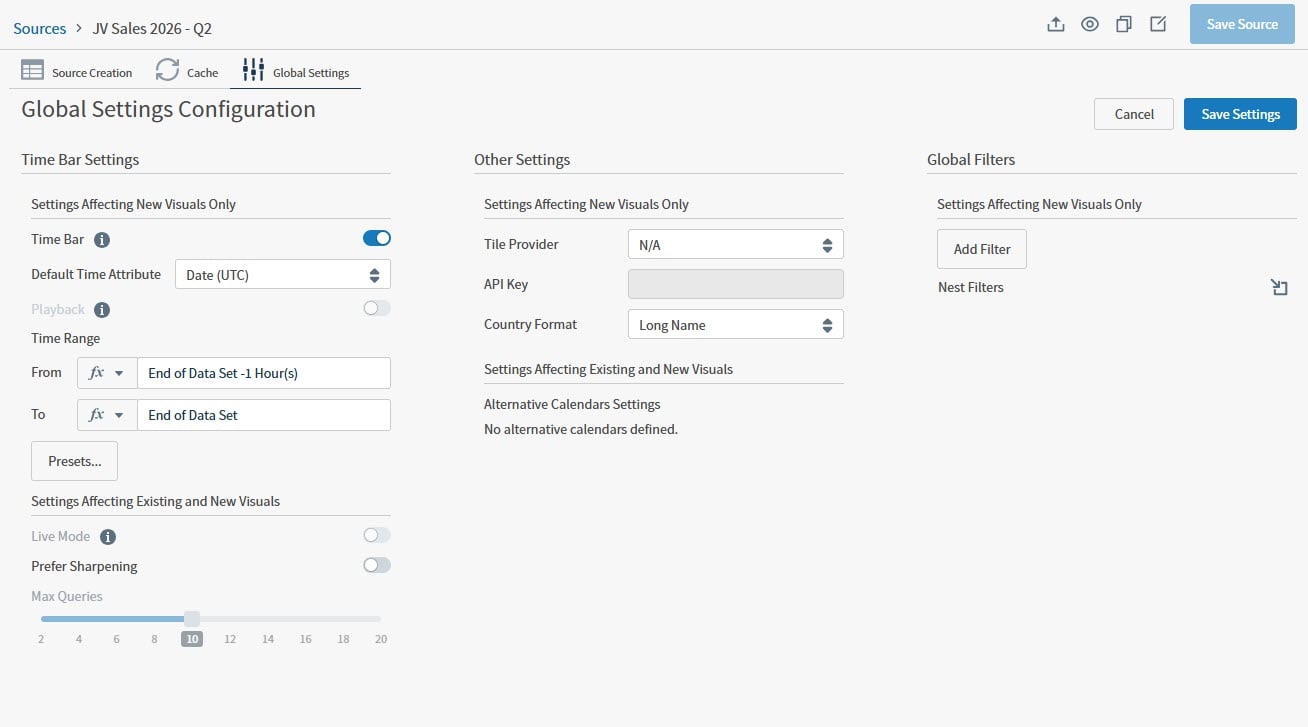
Time Bar Settings
If time fields are available in this data source, you can adjust the global settings here. The following table describes the time bar settings you can alter for new and existing visuals.| Setting | Description | New Visuals | Existing Visuals |
|---|---|---|---|
| Time Bar | All settings for Time Bar Settings here are disabled if the Time Bar toggle is disabled. Enable to allow setting of time bar related values.
| Yes | No |
| Default Time Attribute | Select an available time field to use, by default, for new visuals. Options vary based on the time field in your data source. | Yes | No |
| Playback | Enable to allow playback for optimal time fields, such as time fields with indexes, partitions, or other query optimizations from your data source. | Yes | No |
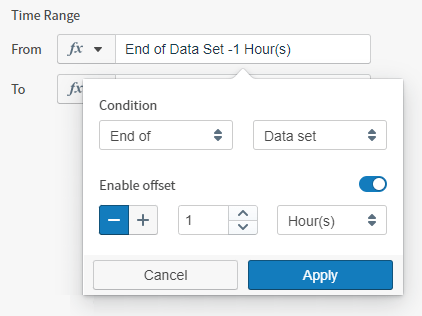
| Time Range | Define the time range for the time bar. By default, the time range runs from the end of the data set minus one hour to the end of the data set as dynamic time. If you do not want to use the default, you can select a preset value from Presets… or design your own Conditions for the From and To fields. See Configure Time Bar Defaults. | Yes | No |
| Live Mode | Enable to allow live stream updates from data sources that are not file-based data sources. When enabled, you can adjust live settings and enable a delay as needed. | Yes | Yes |
| Refresh Rate | Use Refresh Rate to specify the data refresh rate of the Default Time Attribute for this data source. The time granularity for this refresh rate is defined as Granularity on the Fields tab. For information about using the REST API to identify and modify refresh rates, see Configure Data Source Refresh Rates Using the API. | Yes | Yes |
| Delay By | Use Delay By to specify the delay time when playing data in live mode. | Yes | Yes |
| Prefer Sharpening | Enable to allow Data Sharpening for data sources that support it. | Yes | Yes |
| Max Queries | When Prefer Sharpening is enabled, you can use this slider to adjust the maximum number of queries for data. See Enable Data Sharpening and Configure Its Defaults | Yes | Yes |
Other Settings
The following table describes the other settings you can alter for new and existing visuals.Global Filters
The following table describes the filter settings you can alter for new visuals. If you define initial filters, you can increase the performance of new visuals the first time you load them.| Setting | Description |
|---|---|
| Add Filter | Select Add Filter to add a filter to new visuals created using this source. |
| Nest Filter | Select the Nest Filters ( ) button to nest your filters for new visuals created using this source. ) button to nest your filters for new visuals created using this source. |
Cache Tab
In this release, when your admin enables the Enhanced Experience user interface, you will see changes to workflows you may have used in previous releases.
-
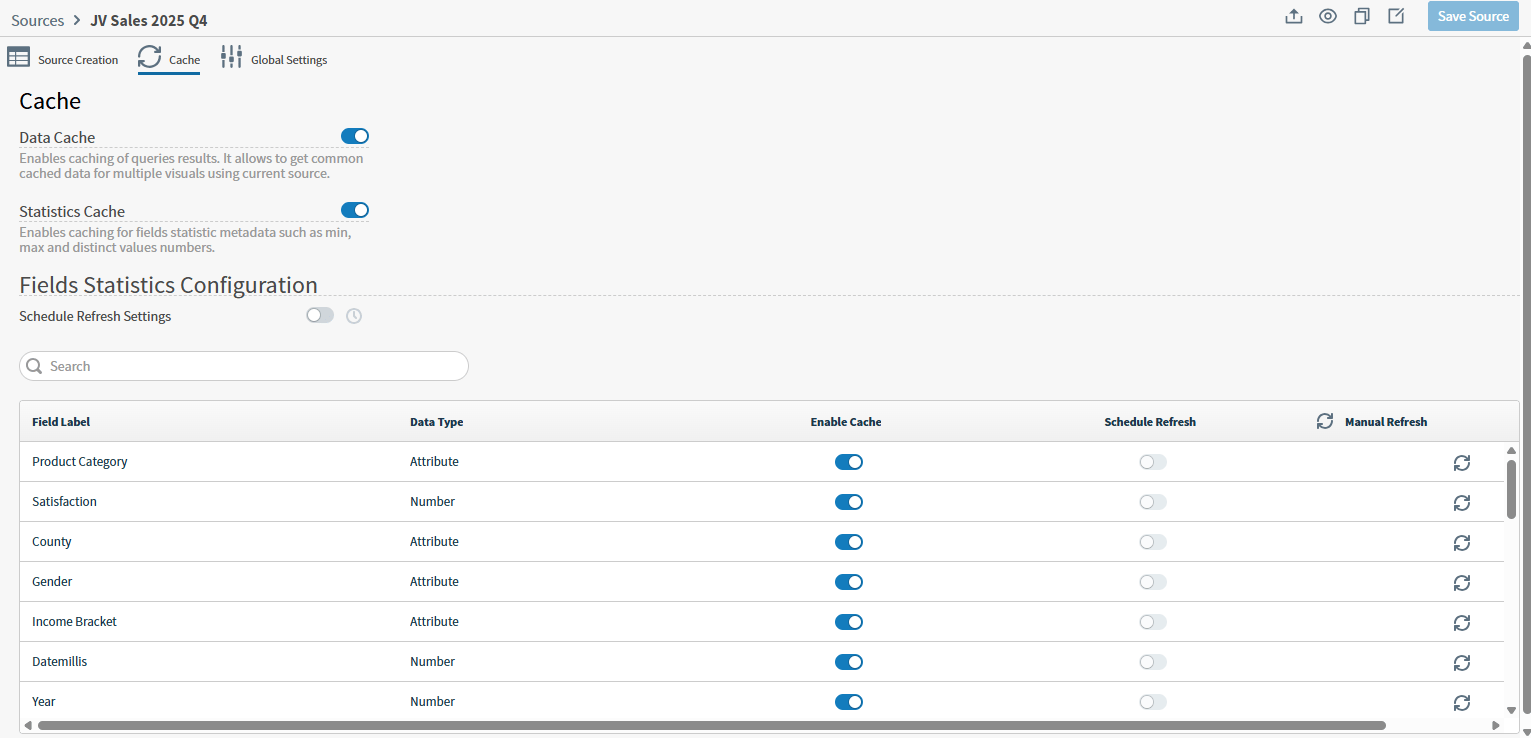
Enable or disable Data Cache for this source. Any change you make to this section is automatically saved.
- When you enable Data Cache, Self-Service Analytics caches query results and common cached data for multiple visuals that use this source.
- When disabled, this metadata is not cached.
-
Enable or disable Statistics Cache for this source. Any change you make to this section is automatically saved.
- When you enable Statistics Cache, field metadata, such as minimum, maximum, and distinct values numbers are cached. You can enable and disable caching for individual field statistics when enabled.
- When disabled, the Fields Statistics Configuration work area is disabled. If you disable this after setting up Schedule Refresh Settings, your schedule is deleted.
-
Manage caching for individual fields in the Field Statistics Configuration work area. Any change you make to this section is automatically saved.
-
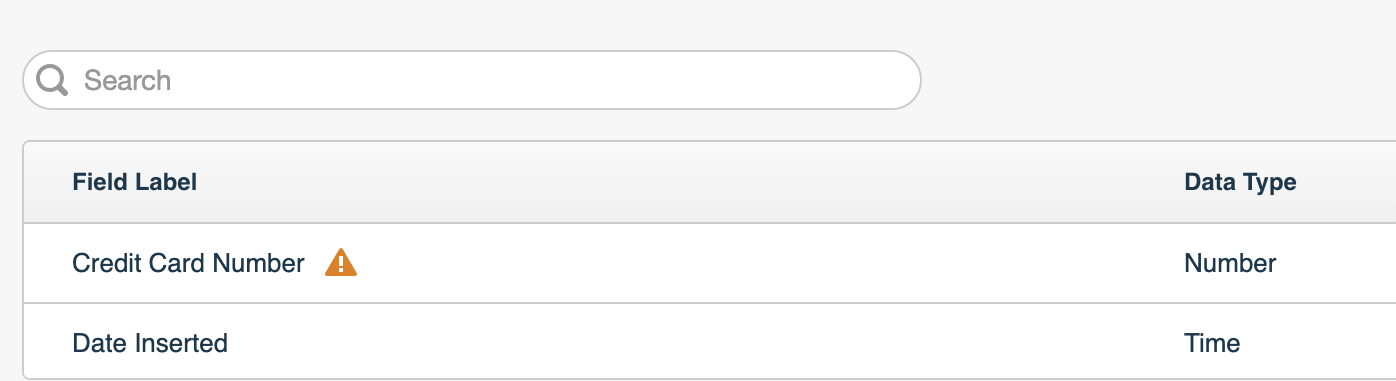
You can enable or disable caching for each field, scheduled refreshing for each field, or manually refresh each field if needed. Fields that include a statistics override that prevents refreshing are indicated by an exclamation point in a triangle.
-
You can enable or disable caching for each field, scheduled refreshing for each field, or manually refresh each field if needed. Fields that include a statistics override that prevents refreshing are indicated by an exclamation point in a triangle.
- Use Schedule Refresh Settings to define Periodic or Advanced refreshing of fields with Schedule Refresh enabled. If you disable Schedule Refresh Settings, any schedule you had set up previously is deleted.
-
You can perform several bulk functions related to caching using menus in the header of the fields table.
- Select the Enable Cache menu (
 ) button to quickly enable or disable caching for all fields.
 - Select the Schedule Refresh menu () button to quickly enable or disable scheduled refreshing for all fields. This is available only if you have enabled Schedule Refresh Settings and defined a frequency.
- Select the refresh (
 ) button for Manual Refresh to trigger a manual refresh for all fields.
- Select the Enable Cache menu (
Configure Search Box Defaults
The search box is available for Apache Solr, Cloudera Search, and Elasticsearch data sources and is enabled by default for visuals created using these sources. It allows you to enter keywords to quickly filter the data. You can disable the search box, if needed, in the data source configuration.Disable the Search Box
Disable the search box- Log in as a user with the Administer Sources privilege, or write permission for this source.
- Select the Sources card on your home page or Data Sources from the main menu. The Sources page appears.
- Select the appropriate data source configuration to edit it, then access the Global Settings tab of the data source.
-
Toggle off Enable Text Search in the Other Settings work area if you want to disable the text search option for new and existing visuals.
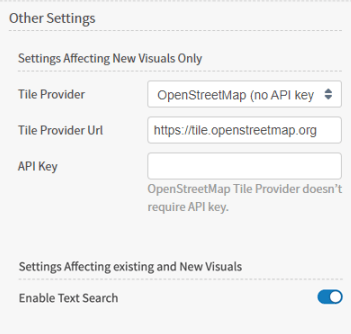
The availability of this setting depends on the data source you have selected. The Search feature is available for Apache Solr, Cloudera Search, and Elasticsearch data sources.
Enable the Search Box
Enable the search box- Log in as a user with the Administer Sources privilege, or write permission for this source.
- Select the Sources card on your home page or Data Sources from the main menu. The Sources page appears.
- Select the appropriate data source configuration to edit it, then access the Global Settings tab of the data source.
-
Toggle on Enable Text Search in the Other Settings work area if you want to enable the text search option for new and existing visuals.
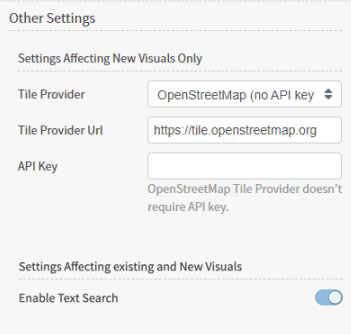
The availability of this setting depends on the data source you have selected. The Search feature is available for Apache Solr, Cloudera Search, and Elasticsearch data sources.
Configure Time Bar Defaults
The time bar feature is available for all visual types. When enabled, it appears at the bottom of a dashboard. You can use the time bar to filter the data in your visuals by a specified time attribute. If more than one data source is used for visuals on a dashboard, the time bar shown on the dashboard depends on the visual that is selected in the dashboard. For information on using the time bar on the dashboard, see Use the Time Bar. You can set time bar defaults for data sources used in your Self-Service Analytics environment. These defaults are specified in data source configurations and are applied to visuals that are created using the data sources. Specifically, you can specify:- The default time field used for the time bar.
- Whether playback and live mode should be available time bar features.
- The default time range used for the time bar.
- Log in as a user with the Administer Sources privilege, or write permission for this source.
- Select the Sources card on your home page or Data Sources from the main menu. The Sources page appears.
-
Select the appropriate data source configuration to edit it, then access the Global Settings tab of the data source.
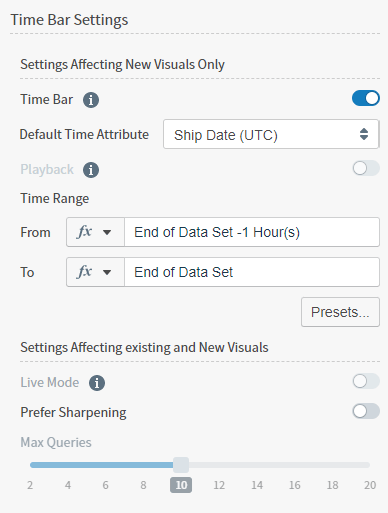
- Enable Time Bar in Time Bar Settings. This allows you to edit all available time bar settings for new visuals. See Global Settings Work Areas
-
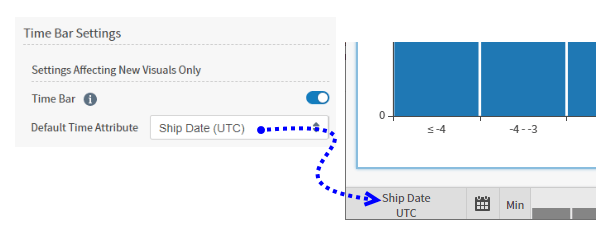
Select the default time field to use in the Default Time Attribute box.
The attribute you select is used as default and is displayed on the time bar after you create and open a new visual:
-
If the time attribute you select is playable, the Enable Playback and Enable Live Mode settings can be changed.
Live mode and historical playback (also know as Data DVR) allow you to get the most from data sources using connectors that support live mode and playback (see Live Mode and Historical Playback). The only difference between live mode and historical playback is the time range that is selected:
- Live mode refreshes field data on your visuals for fields that are indexed as playable. In live mode, your data plays forever without an end date.
- Historical playback (Data DVR) shows the historical record of field data for fields that are indexed as playable. Playback can show up to the last moment before the current period in your data.
- Enable the Playback toggle to show the Play button (Data DVR functionality) on the time bar.
- Enable the Live Mode toggle to enable playing data in live mode.
-
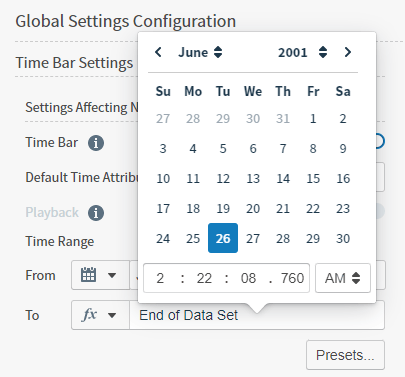
Use the Time Range From and To boxes to specify the default time bar range.
You can set the range in static time or dynamic time, or use preset ranges provided with Self-Service Analytics.
-
Select Static Time or Dynamic Time in the fx drop-down menu.
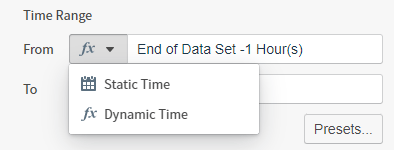
-
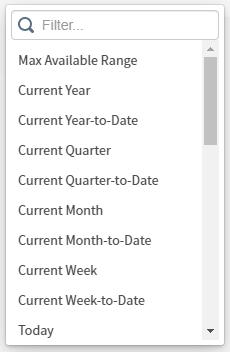
Alternatively, select Presets… to fill the From and To boxes with predefined time ranges provided by Self-Service Analytics:
-
Select Static Time or Dynamic Time in the fx drop-down menu.
-
If you enable live mode for a data source (Enable Live Mode checkbox), you can set the refresh rate and delay time. The time bar defaults expand to show these settings.
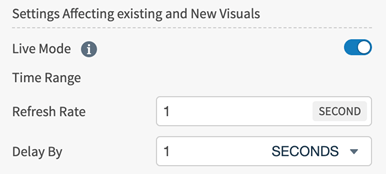
- Use the Refresh Rate box to specify the data refresh rate for the data source. The time granularity for the time field’s refresh rate is defined in the Settings sidebar menu on the Fields tab of the data source. For information about using the REST API to identify and modify refresh rates, see Configure Data Source Refresh Rates Using the API.
- Use the Delay By box to specify the delay time when playing data in live mode.
- When your changes are complete, select Save Settings to save your changes.
How Self-Service Analytics Caches Data
Self-Service Analytics uses a visual cache to enhance performance in scenarios where large numbers of users are concurrently viewing the same shared visuals. A metadata cache is also used to store field statistics. This cached data is shared between users only if they have the same data access permissions and security context. Caching is enabled by default for all data sources. Self-Service Analytics does not re-query the data source for data unless you manually clear the cache, or define a refresh schedule. See Cache Tab and Trigger Refresh Jobs. Available cache settings and options include:- Data Cache: Self-Service Analytics caches query results and common cached data for multiple visuals that use this source. When you create a visual that uses this source, the first data request is sent to the Self-Service Analytics cache. Self-Service Analytics returns the cached data, if available. If the data is not available in the cache, Self-Service Analytics next queries the data source. The results are returned and stored in the cache, and the visual displays the returned data.
- Statistics Cache: When enabled, field metadata, such as minimum, maximum, and distinct values numbers are cached. This toggle also controls the availability of the Field Statistics Configuration option and scheduled refresh settings.
- Field Statistics Configuration: When enabled, you can enable or disable caching and scheduling for individual fields, or manually refresh the cached data for individual fields. Fields that include a statistics override that prevents refreshing are indicated by an exclamation point in a triangle.
- Schedule Refresh Settings: Enable and define Periodic or Advanced refreshing of fields with Schedule Refresh enabled. If you disable Schedule Refresh Settings, any schedule you had set up previously is deleted.
If a Custom Range has been defined for a field, the minimum and maximum fields used in filters remain unchanged when you refresh source data. These fields are shown with cache actions disabled on the Cache tab.
- Clear the Cache for a Data Source Configuration
- Disable Data Caching for a Data Source
- Trigger Refresh Jobs
You can force Self-Service Analytics to bypass the cache and to query the underlying data source by selecting Refresh All from a Self-Service Analytics dashboard menu.
Disable Data Caching for a Data Source
The Self-Service Analytics data cache is a temporary storage area containing the aggregated data from your data sources. Two caches are supported: the visual (visual data) cache and the metadata (field statistics) cache. By default, caching is enabled for all data sources using both caches. However, you can disable all caching if your data source is constantly being updated, or you do not want to allocate the required RAM or if the performance of your data source is so high you do not need to store the aggregated queries. Disable data caching- Make sure you are logged in as a user with the Administer Sources privilege, or a user with read and write permission for the data source.
- Select the Source card on your home page or Data Sources from the main menu. The Data Sources page appears.
- On the Sources page, locate and select the data source configuration you want to edit. The Source Creation work area opens.
-
Select the Cache tab. All the fields from your data source are listed.
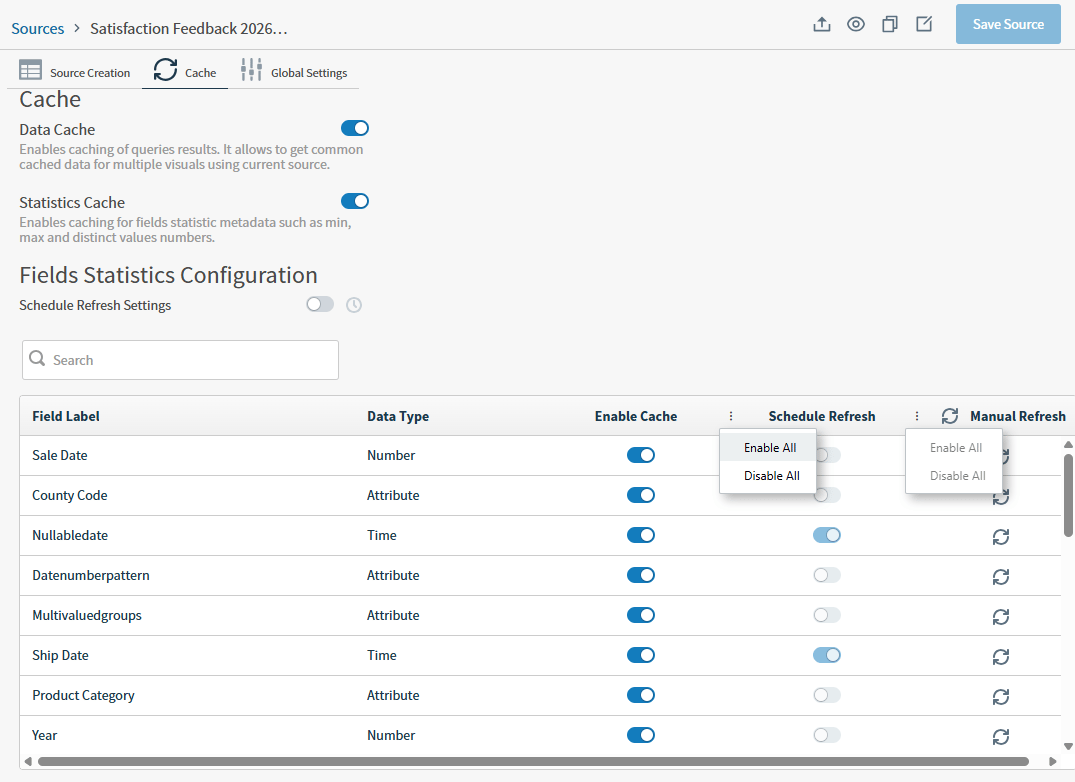
- Disable (toggle off) Data Cache. Data caching is disabled for the data source configuration. Data will be freshly loaded into the Self-Service Analytics cache the next time it is requested from the data source.
- Optionally, Disable (toggle off) Statistics Cache. Field metadata caching is disabled for the data source configuration. Data will be freshly loaded into the cache the next time it is requested from the data source. If you have set up refresh jobs for this data source, a warning appears that the jobs are disabled and the schedule deleted for this data source. Select Ok to continue disabling Statistics Cache and delete the schedule.
- Exit the source data configuration when you have finished making your changes.
Clear the Cache for a Data Source Configuration
You can manually clear the cache for a data source configuration if you are a user granted the Administer Sources privilege or a user with write permission for the data source. Both the visual (visual data) cache and the metadata (field statistics) cache are cleared.In this release, when your admin enables the Enhanced Experience user interface, you will see changes to workflows you may have used in previous releases.
- Log in as a user with the Administer Sources privilege, or a user with write permission for the data source.
- Select the Sources card on your home page or Data Sources from the main menu. The Sources page appears.
- In the table on the Sources page, locate the row displaying the data source configuration with the cache you want to clear.
-
Select the Clear Cache button in the Actions column of the table. The Cache Cleanup work area opens.
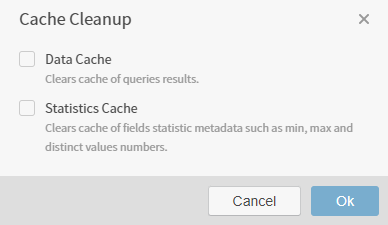
- If available, select Data Cache to clear the query results from visuals.
-
If available, select Statistics Cache to clear the cache of field statistics data such as min, max, and distinct values numbers.
Control the availability of caching options on the Cache tab of a data source.
- Select Ok to clear your selected caches for this data source. The data is freshly loaded into the Self-Service Analytics cache the next time it is requested from the data source. For more information about data caching or to disable it, see How Self-Service Analytics Caches Data.
If a Custom Range has been defined for a field, the minimum and maximum fields used in filters remains unchanged by the action of refreshing the source data.
You can force Self-Service Analytics to bypass and update the cache to query the underlying data source by selecting Refresh from a Self-Service Analytics dashboard menu.