
When you create a filter snippet, it is linked to the dashboard you have added it to. If you delete a dashboard, the snippet is deleted as well.
- Add Filter Snippets to a Dashboard
- Connect Visuals to a Filter Snippet
- Link Filter Snippets
- Custom Values for Filter Snippets
- Use the Filter Snippet Menu
- Use The Filter Snippet Sidebar Menu
- Edit or Delete Filter Snippets
Add Filter Snippets to a Dashboard
When you create a dashboard or edit an existing dashboard, add filter snippets to allow your users to view and highlight data pulled from one or more sources in multiple visuals. Filter by three data types: Attribute, Number, or Time. Link multiple filter snippets to provide secondary and tertiary filtering on your visual data.When you create a filter snippet, it is linked to the dashboard you have added it to. If you delete a dashboard, the snippet is deleted as well.
Create a New Filter Snippet
-
Create or edit a dashboard that includes one or more visuals.
- To add a snippet to an existing dashboard, log in as a user with
READandWRITEpermissions for the dashboard. - If you are creating a new dashboard, log in as a user with the Create Dashboards or Administer Dashboards group privilege.
- To add a snippet to an existing dashboard, log in as a user with
-
Select the Add Filter Snippet icon
 in the dashboard icon bar. A new filter snippet is added in a widget on the dashboard, ready to edit.
-
Select the Settings icon
 from the Show More menu
  to open the filter snippet sidebar menu. See Use The Filter Snippet Sidebar Menu.
- Define the Data Settings for this filter snippet by selecting a Data Type of Attribute, Number, Time, or Hierarchy.
- Select an Operator for your Data Type. Available operators are dependent on the data type selected.
- Select an available Source. Any visuals in this dashboard that use this source can be affected by this filter snippet.
- Select an available Value Column. After you have made this selection, other options may be available that allow you to define how the data is presented. After making these choices, select Apply.
- Optionally, select the Filters sidebar menu to add more filters to the snippet that utilize the same or different sources.
-
Select Connect Widgets from the Show More menu to add visuals or to link existing filter snippets you want filtered to this filter snippet. The Connect Widgets work area opens.
-
Select Add Widget. Select a Widget Name and an available Field. Repeat to add as many widgets as desired.
- Select the remove icon
 to remove a widget from the filter.
 - Select the connect icon to connect all widgets present in the dashboard for the data source.
- Select the remove icon
- Select Apply to use the selected widgets to this filter snippet. If you have added all available widgets, the work area closes and links the widgets automatically.
- Save the dashboard.
Use The Filter Snippet Sidebar Menu
Use the filter snippet sidebar menu to:- Define data settings for the filter snippet
- Define filter snippet settings
- Apply filters and hierarchical filters (if available) to the filter snippet
- Adjust widget settings for the filter snippet
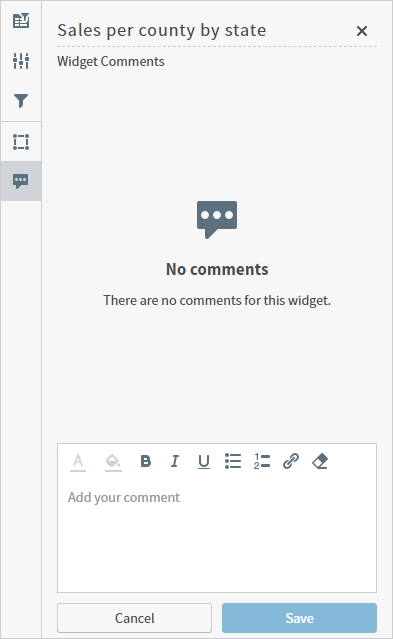
- Manage comments for the filter snippet
. The filter snippet sidebar opens.
Filter Snippet Sidebar Menus
If you are editing a filter snippet that references unavailable sources or fields, an Unavailable message is shown in the affected drop-down. Select a new source or fields as needed.
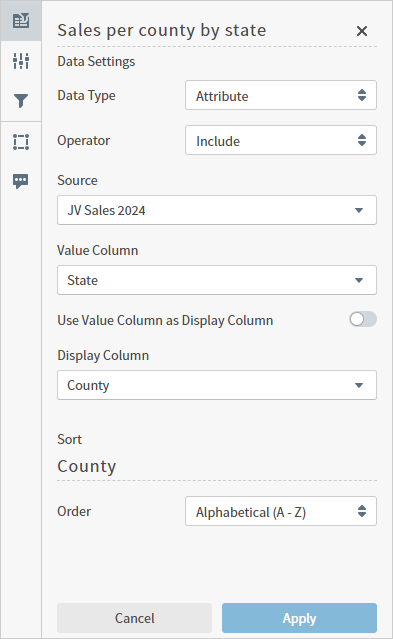
Data Settings
Adjust the data settings for this filter snippet, then select Apply as needed to apply your changes to the filter snippet.| Setting | Description |
|---|---|
| Data Type | Select a data type to filter: Attribute, Time, Number or Hierarchy. If you select Time, you can set conditions for the time spans Between or Not Between in the widget itself if the display style is Range. |
| Operator | Select an operator to use:
|
| Source | Select an available source to use. After you select a source, you can select an available field from that source to use as a Value Column for the filter, and a different Display Column if needed. |
| Value Column | Select an available field for the Value Column. Your users can filter the data in attached widgets using these values. If you prefer to use a different column as a Display Column, disable Use Value Column as Display Column. If you have Filtered a field to prevent users from seeing or exporting this data, you must disable Use Value Column as Display Column to select the column, then select a Display Column. See Filter Data With Masked Fields. |
| Display Column | Select a different field than the Value Column to use as a display column for your users. Only visible when you disable Use Value Column as Display Column. If you have Filtered a field to prevent users from seeing or exporting this data, you must disable Use Value Column as Display Column to select the column, then select a Display Column. See Filter Data With Masked Fields. |
| Granularity | Available for Time data types. Select an available option based on the granularity of the data provided. |
| Sort | Select an order to sort the filter values by. Available options depend on the selected data type. The column data used to sort is listed below the Sort heading.
|
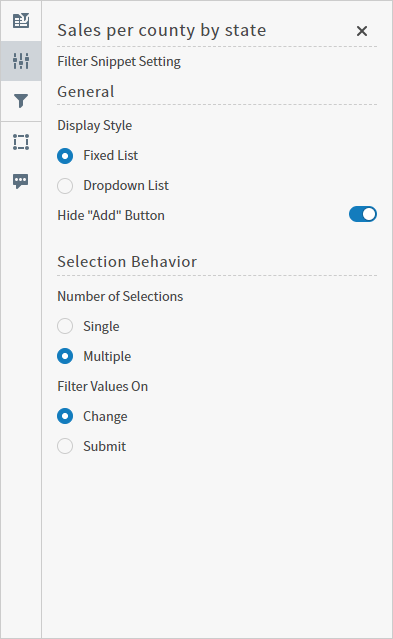
Filter Snippet Settings
Adjust the filter snippet settings in this work area. Save the dashboard to save your changes.| Setting | Description |
|---|---|
| Display Style | Select Fixed List to display all available selection items in a selection list.
Select Dropdown List to display all available selection items in a drop-down list.
Enable or disable the Hide “Add” Button toggle to control if users can add their own items. |
| Number of Selections | Specify whether only one or multiple data values can be selected in the filter snippet. Select Single to allow users to select only one data value; select Multiple to allow users to select more than one value.
|
| ”No Selection” Label | Visible when the Single option for Number of Selections is selected. Enter text to display when no values have been selected. Default text is None. |
| Placeholder Text | Visible when both the Dropdown List and Multiple options are selected. Enter text to display in the Search field when no values have been selected. Default text is Search. |
| Filter Values On | Visible when the Multiple option for Number of Selections is selected.
|
| Submit Button Text | Visible when the Submit option for Filter Values On is selected. Enter text to display for users to apply the filter snippet to connected visuals. Default text is Submit. |
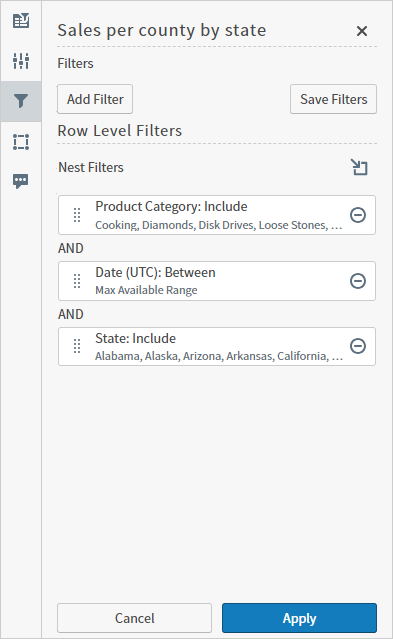
Filters
Apply or create filters in this work area. Save the dashboard to save your changes.Widget Settings
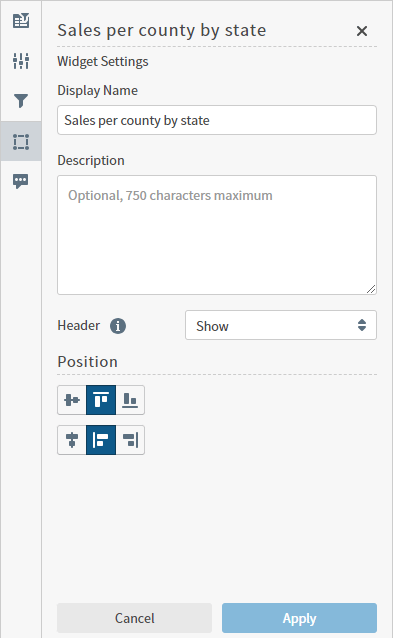
Adjust the widget settings for this filter snippet, then select Apply as needed to apply your changes to the filter snippet. Save the dashboard to save your changes.| Setting | Description |
|---|---|
| Display Name | The display name for this filter snippet. Change here or edit directly in the widget. |
| Description | An optional description for this filter snippet. Blank by default. Maximum 750 characters. |
| Header | Adjust the header behavior. The default setting is
|
| Position | Adjust the position of the widget content in the cell (widget footprint in the dashboard) to align vertically and horizontally as appropriate within the space. Select center, top, or bottom as needed. |
Comments
If you have access to comments, manage them on this tab. See Widget Comments.Use the Filter Snippet Menu
The filter snippet menu includes options that help you modify and use these snippets in your dashboard. Access it by selecting in the upper right corner of a snippet widget.
The menu options are described in the following table.
| Option | Description |
|---|---|
| Edit | Select to edit the custom values of a filter snippet by removing them, or if it is open for editing, put it in view mode. Select  to remove a custom value. to remove a custom value.You can additionally access this option by selecting the edit icon (  ) in the snippet header. ) in the snippet header. |
| Settings | Open the sidebar menu. Use to
|
| Connect Widgets | Select to connect visuals or filters to the filter snippet. See Connect Visuals to a Filter Snippet and Link Filter Snippets. |
| Remove Widget | Remove the selected filter snippet from the dashboard. See Edit or Delete Filter Snippets. |
Edit or Delete Filter Snippets
As the owner or editor of a dashboard, you can make several changes to the filter snippet:- Add, remove, or change sources
- Connect visuals to the filter snippet
- Remove the filter snippet
- Adjust the settings for the filter snippet using the filter snippet sidebar
Users with Viewer access can add custom values to the snippet to filter connected visuals.
Edit a Filter Snippet
- Select the snippet on the dashboard. A blue border appears around the snippet widget.
- Select Settings from the Show More menu () to open the filter snippet sidebar menu.
- Use the sidebar menu to update data settings, filter snippet settings, or widget settings.
- When you have finished making changes to the snippet, save the dashboard.
Delete a Filter Snippet
- Edit the dashboard. See Edit a Dashboard.
- Select the filter snippet to be removed.
- Select Remove Widget in the snippet drop-down menu. A removal confirmation dialog opens.
- Select Delete on the warning dialog to confirm the deletion.
Link Filter Snippets
You can connect multiple filter snippets to one another to further refine the data you highlight in your dashboard. Link filter snippets- Select the snippet on the dashboard. A blue border appears around the snippet widget.
-
Select
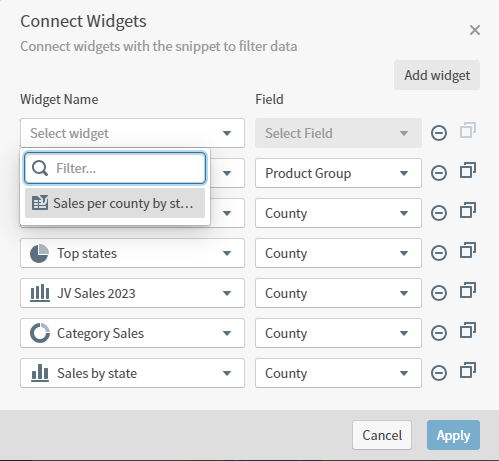
 Connect Widgets from the menu (). The Connect Widgets work area opens.
-
Select Add Widget. Select a Widget Name to filter and an available Field.
Filters you link must use a data source associated with the dashboard.
- Repeat to add as many filters as desired. Select the copy icon to quickly add all visuals and filter snippets from the dashboard that share the same data source.
- Optionally, remove widgets by selecting the delete icon next to each widget.
- Select Apply to connect the filters.
- Your filters are linked and you can filter the data shown in connected visuals using both filters.
When you create a filter snippet, it is linked to the dashboard you have added it to. If you delete a dashboard, the snippet is deleted as well.
Connect Visuals to a Filter Snippet
Build and use filter snippets to filter and highlight data on your dashboard. To apply filters to visuals, connect a filter snippet to one or more visuals using a corresponding field from the visual’s underlying source. You can also filter a filter snippet by another filter snippet. Connect visuals- Select the snippet on the dashboard. A blue border appears around the snippet widget.
-
Select Connect Widgets from the menu (). The Connect Widgets work area opens.
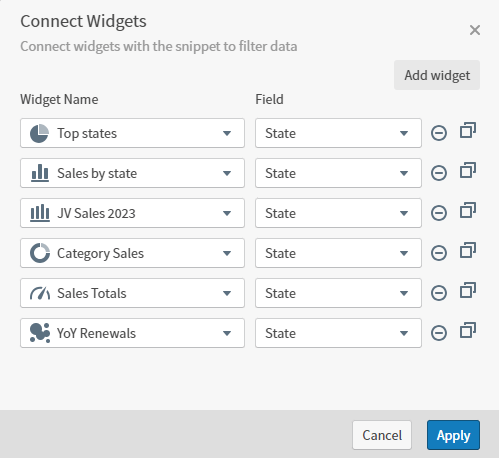
- Select Add Widget. Select a Widget Name and an available Field.
- Repeat to add as many visuals or filter snippets as desired. Select the copy icon to quickly add all visuals and filter snippets from the dashboard that share the same data source.
- Optionally, remove widgets by selecting the delete icon next to each widget.
- Select Apply to connect the visuals.
When you create a filter snippet, it is linked to the dashboard you have added it to. If you delete a dashboard, the snippet is deleted as well.
Custom Values for Filter Snippets
All users with access to a dashboard can add custom values to a filter snippet to filter connected visuals.- Users with Viewer access can add custom values to the snippet to filter connected visuals.
- Owners and editors can add custom values and remove custom values any user has added.
-
Enter a value in the Search field of a filter snippet. If the value is not part of the filter, add the value by selecting Add or the add
 icon.
icon.
-
If applicable, select the Submit button to apply your changes to the connected visuals.
Users with Viewer access can delete custom values by selecting delete icon before saving the dashboard under a new name.
-
When you have finished making changes to the snippet, save the dashboard.
- Owners and editors can save the dashboard as is, or save it using a new name.
- Users with Viewer access can save the dashboard using a new name. Changes to the existing dashboard are not retained.
- Select the snippet on the dashboard. A blue border appears around the snippet widget.
- Select the edit icon
 to edit the list of custom values.
 - All custom values you can remove have a delete icon . Select to delete the value.
- When you have finished making changes to the snippet, save the dashboard.
Filter Data With Masked Fields
Filter snippets allow your users to view and highlight data pulled from one ore more sources in multiple visuals. In some cases, however, you may want to allow your users to filter information using sensitive data without exposing that data. To do this, disable Filtering for one or more fields in a data source, create a new filter snippet that uses one or more of those fields, and connect your visuals as needed. Users then can view filtered data based on those fields, but the values and name of the fields are masked. If users export this information, it is presented in a masked format. If the values are included as data fields or auto-generated descriptions, they are represented by asterisks******.
Disable Filtering for a field’s data column
- Navigate to the Fields tab of your data source, then select Bulk Field Capabilities. The Bulk Field Capabilities work area opens.
- Find your fields by scrolling, searching, or filtering.
- Select the toggle in the Filtering column to disable (slide left) each field as needed.
- Save your changes. A success message is returned. Next, create a filter snippet that uses this field.
- Open and edit a dashboard.
-
Select on the dashboard icon bar. A new filter snippet is added in a widget on the dashboard, ready to edit.
-
Select Settings from the more menu () to open the filter snippet sidebar menu. See Use The Filter Snippet Sidebar Menu.
-
Open
 Data Settings in the filter sidebar menu, then select your Source. A Value Column field appears, but you can not add your Filtered field to it.
- Disable Use Value Column as Display Column. With this disabled, you can select your Filtered field as the Value Column.
- Select a different field to use as the value for the Display Column.
- Continue creating the filter snippet by connecting widgets as needed. Select Apply to apply your changes.
- Save the dashboard. Users can now use the filter snippet to change how data is presented, but not see or export the values you have disabled filtering for.