
If you have the Administer Initial Visuals privilege, you can update available visual types as needed.
- Make sure you are logged in as a user with the Administer Initial Visuals privilege.
- Select the Source card on your home page or Data Sources from the main menu. The Sources page appears.
-
On the Sources page, locate a data source configuration to edit, and select the more menu (
 ) button.
-
Select Available Visual Types. The Available Visual Types work area for this source opens.

-
Select to enable and disable the visuals you want user to be able to use for this source. All Visual Types are shown by default: select Standard Visual Types or Custom Visual Types to edit those lists only, or use the search field to find a specific visual.
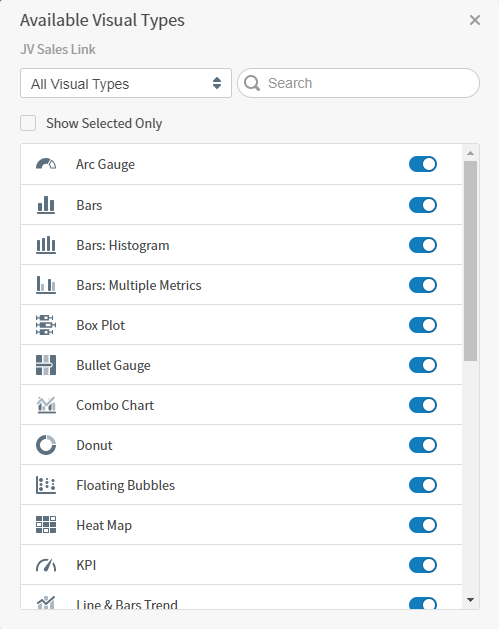
- After completing your changes, close the work area to save your changes for this source. All available data fields are automatically included in these default visual settings.
- Single Metric Visuals
- Bar Chart Styles (includes standard, histogram, and multiple metric charts)
- Box Plots
- Bullet Gauges
- Combo Charts
- Donut Charts
- Floating Bubble Charts
- Heat Maps
- KPI Charts
- Line Charts (includes line & bar, attribute value, and multiple metric charts)
- Map Visuals (includes marker, US region, and world maps)
- Circular, Tree, and Cloud Visuals
- Pivot Tables
- Scatter (Bubble) Charts (includes floating bubble, packed bubble, and scatter plot charts)
- Sunburst
- Tables
- Tree Maps
- Waterfall
- Word Clouds
Re-Visualize (Change a Visual Type)
After creating a visual, you can change to a different visual type and re-visualize the data in a different format, with emphasis on more or different data. Based on the data source you are using, certain visual types may not be available. Change a visual’s type- Select the visual in the dashboard or in the Visual Gallery.
-
Select the re-visualize (was visual style) icon (
 ) on the sidebar menu for the visual. The Re-Visualize sidebar opens.
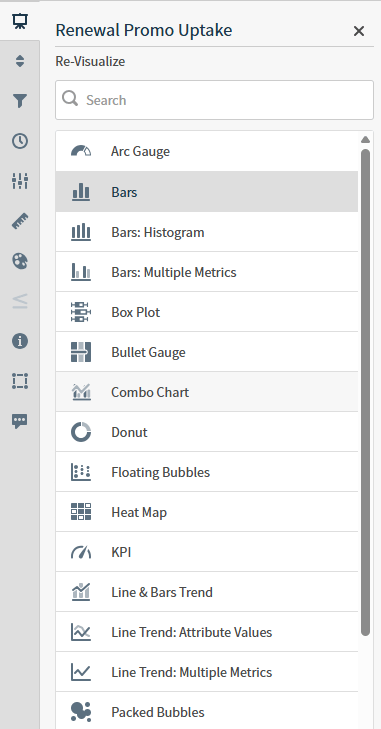
- In the Re-Visualize sidebar, select the visual style you want to use. Use the search bar at the top of the sidebar to quickly locate a style in the list. Type any letter in the search bar and sidebar is filtered to show only visual style names that include that letter.
Use the Re-Visualize Sidebar
The Re-Visualize sidebar (formerly Visual Style sidebar) lets you quickly change the type of visual displayed in a dashboard visual or when you are editing a visual in the Visual Gallery. Controls for changing the type of a visual are provided using the interactivity sidebar. See Control How Users Interact With a Visual.When you re-visualize a visual, its published and subscribed links are removed. See Control How Cross-Visual Filters Interact in a Dashboard.
A list filter visual cannot be converted to a different type. Likewise, other visual types cannot be converted to the list filter visual type.
- Select the visual in the Visual Gallery or on a dashboard.
- If you selected the visual on a dashboard, select Settings on the visual drop-down menu to access the sidebar menu for the visual.
-
Select the re-visualize option () on the sidebar menu for the visual. The Re-Visualize sidebar opens.
- Select a visual option from the list.