
Visual Names and Display Names
Visual names are the unique name of a visual in the Visual Gallery; you assign the name when you create it, are names you assign to a visual when you create it or add it to the visual gallery from a dashboard. The visual name is used by Self-Service Analytics to track the visual throughout the environment and must be unique. Local visuals do not use visual names. Display names are the unique name you assign to a visual in a dashboard when you create a local visual, or inherit when you add a visual gallery visual. This display name is shown in the header of the visual.The field Default Title is now Display Name. Visual Names are no longer editable in the visual information sidebar when you open a specific visual in a dashboard. Edit the visual name when you open the visual in the Visual Gallery.
- When you change a visual name, this change is reflected throughout the environment in the Visual Name field. See this change in the visual information sidebar.
- When you change a display name, this change is reflected in the dashboard where the visual is included. If you convert a local visual to a visual gallery visual, the display name is inherited by the visual name field. View the visual name or display name in the visual information sidebar.
(<n>) at the end of the name to make it unique for that circumstance. If Self-Service Analytics returns an error, change the name manually and save it.
Change the Visual Name for a Visual Gallery Visual
Change the Visual Name for a visual gallery visual in the Visual Gallery at any time. This does not affect the display name for visuals included in existing dashboards.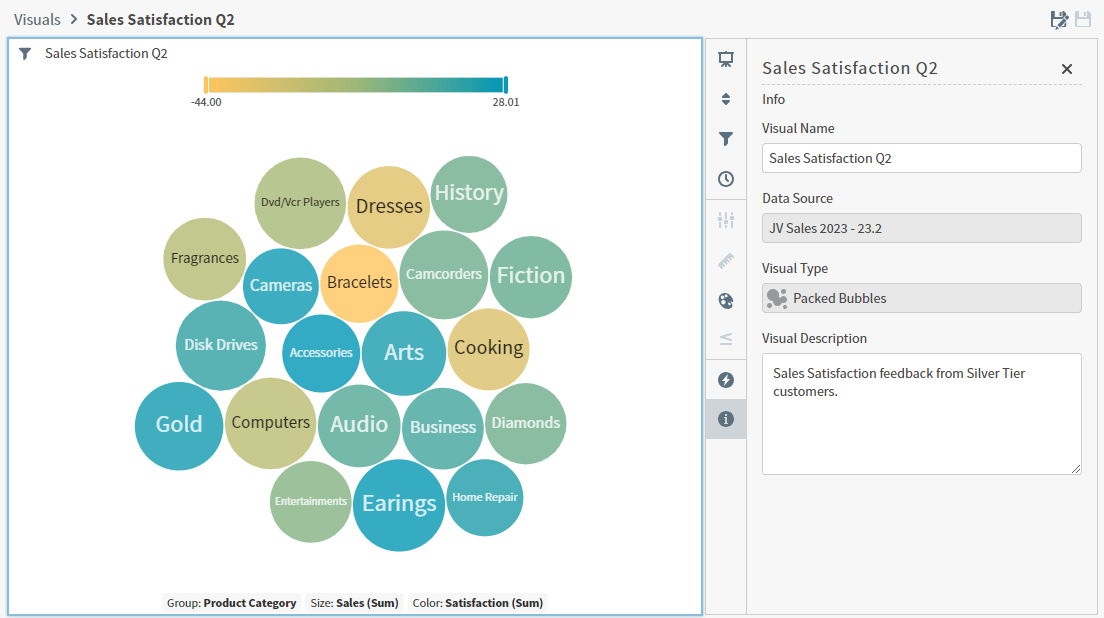
- If you try to save a visual in the Visual Gallery that has the same name as another visual, an error message appears and your visual is not saved. Rename the new visual to save it.
- If you try to add a visual to the Visual Gallery from a dashboard that has the same name as another visual, the visual is saved with an incremented number in parentheses
(<n>)at the end of the name.
Change the Display Name for a Visual
Change the Display Name for a visual in a dashboard at any time, using visual information sidebar, or by editing the name in the header of the visual. This only affects this specific instance of the visual in this dashboard, and does not affect the Visual Name field for visual gallery visuals.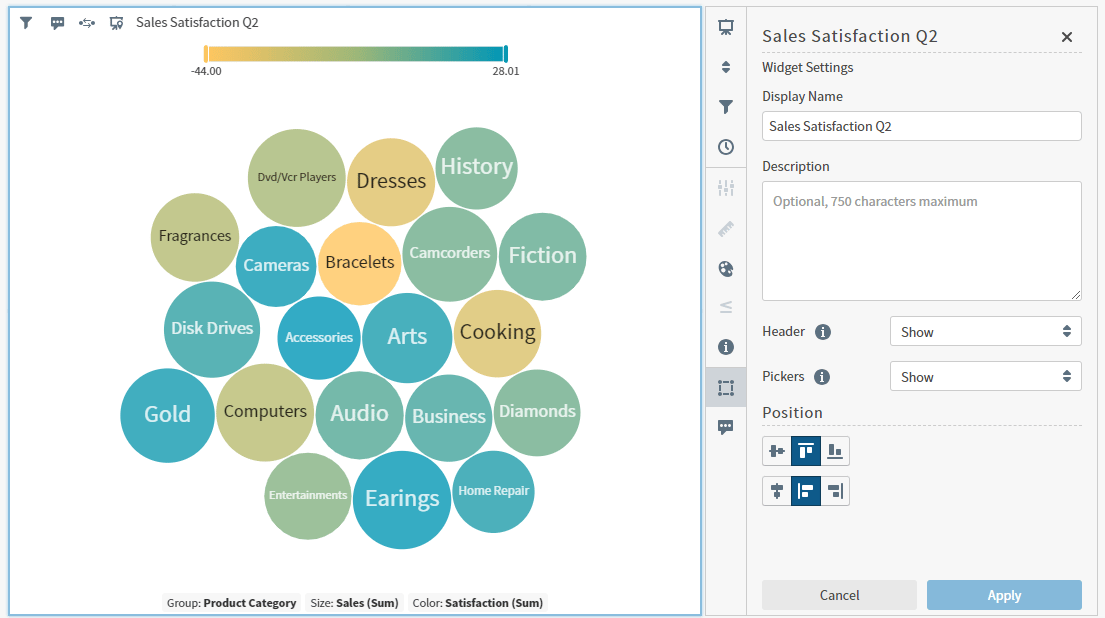
| From the… | Action | Visual Name and Display Name Behavior |
|---|---|---|
| Visual Gallery | Create a visual | When you create a visual using the Visual Gallery, but do not assign a name, its visual name is Untitled Visual. The Display Name is also Untitled Visual.
|
| Edit a visual | When you edit a visual using the Visual Gallery:
| |
| Dashboard | Create a visual | When you create a new local visual while creating or updating a dashboard, its initial Display Name is the same as the name of the data source used for the visual.
|
| Edit a visual | When you edit a visual in a dashboard and change the Display Name, the change only affects that instance of the visual. No other occurrences of the visual on other dashboards are affected. You cannot change the Visual Name for visual gallery visuals using the dashboard. Edit the visual name in the Visual Gallery. View the visual name on the visual information sidebar. |
Descriptions
Descriptions give you an opportunity to provide more information about resources in your standalone or embedded environment for all or some of your users. You can provide descriptions for most major objects that make up your environment:- Sources: Add a Description when you create or update a source in your environment. This information is viewable and searchable from the Sources work area. See Add or edit the Description for a source.
- Visuals: Add a Visual Description to shared visuals in the Visual Gallery. This information is viewable and searchable from the Visual Gallery work area. See Add or edit the Visual Description for a visual.
- Dashboards: Add a Description to dashboards in your Library. This information is viewable and searchable from the Library work area. See Add or edit the Description for a dashboard.
- Reports: Add a Description to reports in your Library. This information is viewable and searchable from the Library work area. See Add or edit the Description for a report.
- Widgets: Add a Description to any widget on a dashboard: visuals, text snippets, or filter snippets. For shared visuals from the Visual Gallery, this does not replace the Visual Description. See Add or edit the Description for a widget.
- Create or edit a data source.
- Edit the Description field in the Source Definition work area, then select Save to save your changes.
-
Open the Sources work area, then select the info icon (
 ) to view the description for this source.
Optionally, use the Search field to search for a source by information in its description.
) to view the description for this source.
Optionally, use the Search field to search for a source by information in its description.
- Create or edit a visual in the Visual Gallery.
-
Select the info icon () to open the info sidebar menu.
- Edit the Visual Description field in the info work area, then select Save to save your changes.
-
Select the save icon (
 ) to save the visual.
-
Open the Visual Gallery work area, then select the info icon () to view the visual description.
Optionally, use the Search field to search for a visual by information in its visual description.
Alternatively, you can add or edit the Visual Description when you save a visual, use Save As to rename a visual, and when you convert a local visual to a shared visual.
The Visual Description you can access here is not the same as the generated visual summary description you can generate and add to a rich text snippet in a dashboard. See Describe Visual (Generate Visual Summary Description)
- Create or edit a dashboard.
- With the dashboard open, select Save or Save As to save the dashboard. The appropriate Save dialog opens.
- Edit the Description field, then select Save to save your changes.
-
Open the Library, then select the info icon () to view the description for this dashboard.
Optionally, use the Search field to search for a dashboard by the information in its description.
Select the info icon () in the dashboard tool bar to show or hide the dashboard description for viewers.
- Create or edit a report.
- With the report open, select Save or Save As to save the report. The appropriate Save dialog opens.
- Edit the Description field, then select Save to save your changes.
-
Open the Library, then select the info icon () to view the description for this report.
Optionally, use the Search field to search for a report by the information in its description.
- Select a widget in your dashboard, then select Settings to open the sidebar menu. The menu opens to the Widget Settings panel.
- Edit the Description field, then select Apply to apply your changes.
- Select the save icon () to save the dashboard.
Modify Visual Names, Display Names, and Descriptions
Update the information about your visuals in the Visual Gallery easily to organize and display extended information about these visuals. This includes:- Visual Name - The name of the visual as saved in the visual gallery. View on the Info panel in the visual gallery.
- Visual Description - A short description of the visual. Searchable in the Visual Gallery. View on the Info panel in the visual gallery.
- Display Name - The name of the visual as displayed in dashboards. View and edit in the Widget Settings panel in a dashboard.
- Description - A short description of the widget. View and edit in the Widget Settings panel in a dashboard.
To modify Descriptions for other resources in your environment, see Descriptions.
The Visual Description you can access here is not the same as the generated visual summary description you can generate and add to a rich text snippet in a dashboard. See Describe Visual (Generate Visual Summary Description)
- Select the visual to edit in the Visual Gallery.
-
Select the info option () on the sidebar menu for the visual. The Info sidebar opens.
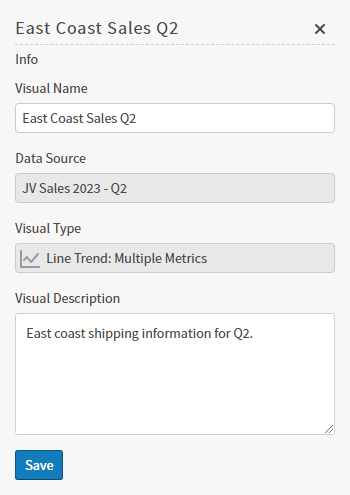
- Change the visual name in the Visual Name field. You can also change the name of a visual by selecting the name in the visual itself. See Configure Visual Names, Descriptions, and Properties.
- Optionally, add a visual description, or edit an existing one in the Visual Description field, up to 750 characters. You can search for the visual using this information in the Visual Gallery.
-
Select Save to save your changes in the sidebar menu, then the Save icon () for the visual to save all of your changes.
- Select a local visual or a shared visual on a dashboard.
- Select Settings on the visual drop-down menu to access the sidebar menu for the visual.
-
Select widget settings (
 ). The Widget Settings sidebar opens. Edit Widget Settings or Position settings as needed.
 Change the display name in the Display Name field. You can also change the display name by selecting the title in the dashboard. See Configure Visual Names, Descriptions, and Properties.
 - Change the description in the Description field, up to 750 characters. There is no description by default.
-
Select a header behavior. The default setting is Show; this displays the header at all times.
- Show (default) displays the header at all times.
- Show on Hover hides the header in Viewer mode unless users perform a hover action over the widget where the header is temporarily hidden.
- Hide completely hides the header in Viewer mode.
-
Customize the picker behavior, if applicable. The default setting is Show; this displays the picker at all times.
- Show (default) displays the picker at all times.
- Hide completely hides the header in Viewer mode.
- Custom allows you to show or hide attributes such as colors, axis labels, and other available attributes or metrics. When disabled, an attribute or metric is hidden in Viewer mode.
- Adjust the Position of the content in the widget, if applicable. See Position Resized Widgets .
-
Select the Save button to save the changes you made in the sidebar menu for the instance of this visual, then the Save icon () for the dashboard to save your changes.
Save Visuals With Their Current Names
When you have finished making changes to a visual on a dashboard, you can save it with its original name. Changes you have made to the visual will appear on all dashboards that use the visual.If you are editing the visual in a dashboard, you can save the visual with its current name when you save the dashboard. However, the default is not to save them when you save the dashboard. You must explicitly elect to save them on the dashboard Save Options dialog. See Save a Dashboard.
To save visuals, you must be logged in a user with write permissions for the visual or with the Administer Visuals group privilege.
- Select the visual on a dashboard or in the Visual Gallery. When selected on a dashboard, a blue border appears around the visual. If you select a visual with a streaming data source, the time bar (Data DVR) appears.
-
Select save () in the upper right corner of the visual.
-
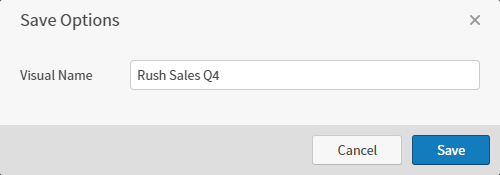
If you are editing the visual in the Visual Gallery, the Save Options dialog appears.
-
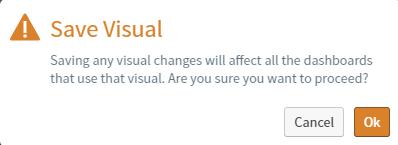
If you are editing the visual in a dashboard, a warning appears indicating that the visual changes will occur for all dashboards that use the visual.
-
If you are editing the visual in the Visual Gallery, the Save Options dialog appears.
Save Visuals With New Names
All visuals have a visual name and display name. When you use the Save As option for a shared visual gallery visual, you affect the visual name. Self-Service Analytics makes a copy of the visual in the visual gallery. The original visual is replaced with the newly named visual if you save a visual with a new name while editing a dashboard.To change the display name of a visual, see Configure Visual Names, Descriptions, and Properties.
| Action | Description |
|---|---|
| Save As in the Visual Gallery | Open a visual in the visual gallery, select Save As, provide a new name, and Save your changes.
You can also add a searchable Visual Description for this visual. |
| Save As in a dashboard | Select a visual in the dashboard, select Save As from the visual drop-down menu, provide a new name, and Save your changes. Self-Service Analytics adds a copy of the visual with the new name to the visual gallery. The visual in the dashboard is replaced by the new visual. |
You can create a local visual by selecting the Copy option for a shared visual using visual drop-down menu. See Copy Visuals.
To save visuals with a new visual name in the Visual Gallery, you must be logged in as an administrator or as a user with the Create Visuals or Administer Visuals group privilege.
- Select the visual in the Visual Gallery.
-
Select Save As in the (
 ) in upper right corner of the visual.
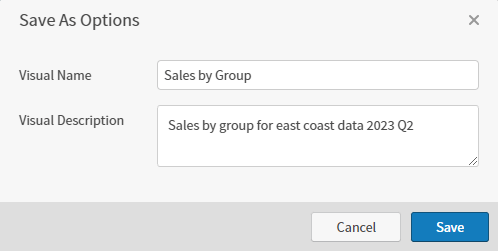
- Specify a new visual name in the Visual Name box and select Save. Self-Service Analytics adds a copy of the visual with the new name to the visual gallery. The original visual still exists with its original visual name in the system.
- Select a visual in the dashboard.
- Select Save As from the visual drop-down menu.
-
- Specify a new visual name in the Visual Name field, optionally add or edit the Visual Description, and select Save. Self-Service Analytics adds a copy of the visual with the new name to the visual gallery. The visual in the dashboard is replaced by the new visual.
Delete and Remove Visuals
You can remove visuals from dashboards and delete them from the Self-Service Analytics instance in the Visual Gallery. You cannot delete a visual if it is used by any dashboard.If you try to delete a visual, filter snippet, dashboard, self service report, dashboard link, source, or source field, Self-Service Analytics displays an error message naming any objects dependent on the item you’re trying to delete. You can delete the item after you’ve removed the association from the dependent object. See Fields Usage.
Remove a Visual From a Dashboard
Remove a visual from your dashboard- Edit the dashboard. See Edit a Dashboard.
- Select the visual to be removed.
-
Select Remove Widget on the visual drop-down (
 ) menu. A removal confirmation dialog opens.
To control whether a visual can be removed, use the interactivity sidebar. See Control How Users Interact With a Visual.
) menu. A removal confirmation dialog opens.
To control whether a visual can be removed, use the interactivity sidebar. See Control How Users Interact With a Visual.
-
Select Delete on the warning dialog to confirm the removal.
Local visuals are deleted completely. Visual gallery visuals remain in the visual gallery.
Delete a Visual from the Visual Gallery
A visual can only be deleted from the Visual Gallery when it is not used in any dashboard. If the Usage column for a visual in the Visual Gallery shows any number except zero, the option to delete the visual is disabled. To delete visuals, you must be logged in as an administrator or as a user belonging to a group with the privilege Administer Visuals enabled. Delete a visual from the Visual Gallery- Access the Visual Gallery. See Use the Visual Gallery.
- Locate the visual in the Visual Gallery.
- Select the delete icon (
 ) in the Actions column associated with the visual. A pop-up dialog is shown, verifying the deletion.
 - Select Delete on the warning dialog to confirm the deletion.