
Exports do not support special characters. If names associated with your visual, such as visual name, display name, or data source name contain special characters, update the name before export.
- Screenshot (PNG) - an image
- PDF - an image
-
Visual Data
- CSV - Comma separated values file
- XLSX - Excel compatible file
-
Raw Data
- CSV - Comma separated values file
- XLSX - Excel compatible file
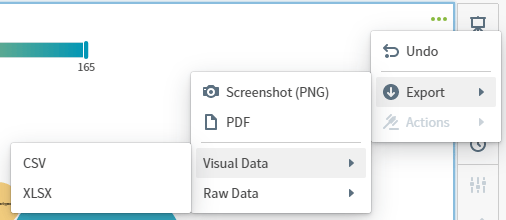
Grouped table data can not be exported as raw or aggregate visual data.
The number of records included is limited by the setting of the
zoomdata.export.data.max.rows property in the zoomdata.properties file. See Configuration Property Files.Export a Visual as XLSX With Formatting
Table visuals can export to Excel (XLSX) files with formatting and conditional formatting when the report service is enabled.- Select Export from the visual drop-down menu. Select the export option XLSX With Formatting.
-
The Export as XLSX dialog opens.
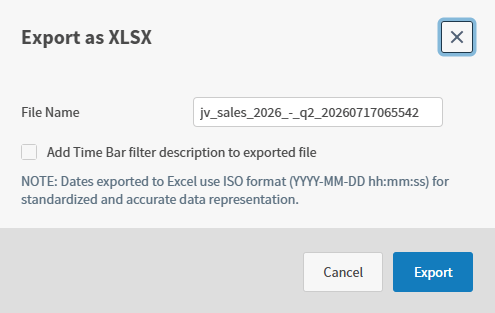
- Accept or change the file name.
- Select Export. Self-Service Analytics prepares an Excel (XLSX) file downloaded by your browser.
- Export Visual Gallery Visuals
- Export a Visual as an Image
- Export Visual Data in CSV or XLSX Format
- Export Raw Data in CSV or XLSX Format
Export a Visual as an Image
Export a visual as a screenshot or PDF- Select Export from the visual drop-down menu. Select an export option for your visual.
- Select an image format on the submenu, Screenshot (PNG) or PDF.
- If you select Screenshot (PNG), the screenshot is prepared, and automatically downloaded by your browser.
-
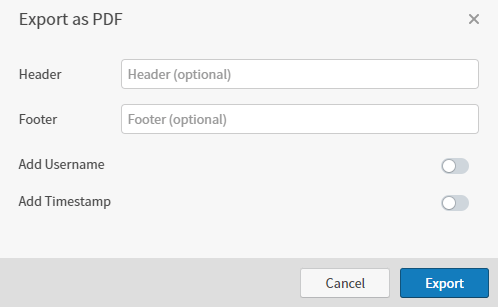
If you select PDF, the Export as PDF dialog opens.
-
Use this work area to optionally:
- Enter a header and footer for your PDF.
- Enable Add Username to include your user name on the PDF.
- Enable Add Timestamp to add a date and time stamp to the PDF.
- Select Export. Self-Service Analytics prepares a PDF downloaded by your browser.
The number of records included is limited by the setting of the
zoomdata.export.data.max.rows property in the zoomdata.properties file. See Configuration Property Files.Export Raw Data in CSV or XLSX Format
When you export raw data from your visuals to XLSX, numeric fields are exported as numbers. Dates are exported as dates in ISO 8601 format. When you export raw data to csv format, both numeric and date fields are exported as strings.. Export raw data in CSV format- Select Export from the visual drop-down menu. Select an export option for your visual.
- Select a file format on the submenu, Raw Data > CSV.
-
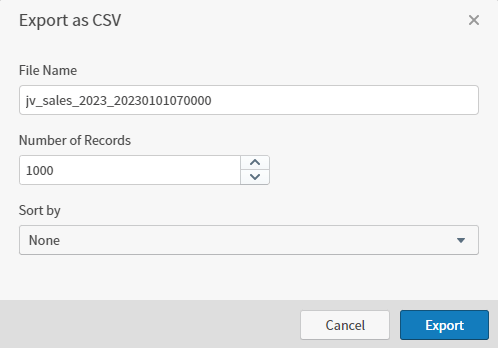
The Export as CSV dialog opens.
-
Accept or change the default settings:
- Accept or change the file name.
-
Specify the Number of Records to include in the export. The default is 1,000.
The number of records you can specify is limited by the setting of the
zoomdata.export.data.max.rowsproperty in thezoomdata.propertiesfile. See Configuration Property Files. - Select a field to sort the data included in the export. The default for Sort by field is none. Depending on the field type selected, you have sort order options you can use to organize your data.
- Select Export. Self-Service Analytics prepares a CSV file downloaded by your browser.
The number of records included is limited by the setting of the
zoomdata.export.data.max.rows property in the zoomdata.properties file. See Configuration Property Files.- Select Export from the visual drop-down menu. Select an export option for your visual.
- Select a file format on the submenu, Raw Data > XLSX.
-
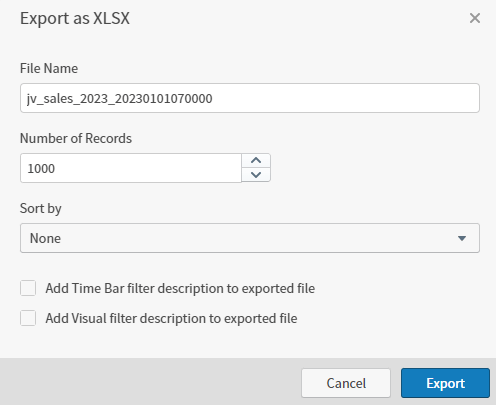
The Export as XLSX dialog opens.
-
Accept or change the default settings:
- Accept or change the file name.
-
Specify the Number of Records to include in the export. The default is 1,000.
The number of records you can specify is limited by the setting of the
zoomdata.export.data.max.rowsproperty in thezoomdata.propertiesfile. See Configuration Property Files. - Select a field to sort the data included in the export. The default for Sort by field is none. Depending on the field type selected, you have sort order options you can use to organize your data.
- Select Add Time Bar filter description to exported file to include in the export.
- Select Add Visual filter description to exported file to include in the export.
- Select Export. Self-Service Analytics prepares an XLSX file downloaded by your browser.
The number of records included is limited by the setting of the
zoomdata.export.data.max.rows property in the zoomdata.properties file. See Configuration Property Files.Export Visual Data in CSV or XLSX Format
Export visual data in CSV or XLSX format- Select Export from the visual drop-down menu. Select an export option for your visual.
- Select a file format on the submenu, Visual Data > CSV or Visual Data > XLSX.
-
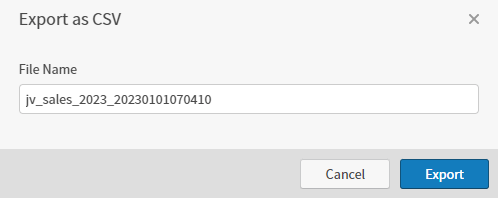
If you select CSV, the Export as CSV dialog opens.
-
If you select XLSX, the Export as XLSX dialog opens.
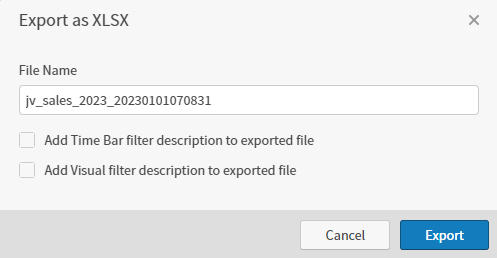
- Accept or change the file name.
- Select Add Time Bar filter description to exported file to include in the export.
- Select Add Visual filter description to exported file to include in the export.
- Select Export. Self-Service Analytics prepares an XLSX file downloaded by your browser.
The number of records included is limited by the setting of the
zoomdata.export.data.max.rows property in the zoomdata.properties file. See Configuration Property Files.Export Visual Data in Excel (XLSX) Format
When you enable self service report microservice in your environment, users can export self service reports and table visuals, complete with formatting and conditional formatting, to a formatted Excel (XLSX) file format.Export a Visual as XLSX With Formatting
Table visuals can export to Excel (XLSX) files with formatting and conditional formatting when the report service is enabled.- Select Export from the visual drop-down menu. Select the export option XLSX With Formatting.
-
The Export as XLSX dialog opens.
- Accept or change the file name.
- Select Export. Self-Service Analytics prepares an Excel (XLSX) file downloaded by your browser.