
insightsoftware recommends using Trusted Access for all embed-related workflows.
Uses of the Application Framework
 | You can use a query to get data from Self-Service Analytics and use it in your own applications. You might want to go this route if:
|
 | You can embed a Self-Service Analytics visual in your application and use your query to supply it with data. You might want to go this route if:
|
 | You can embed a Self-Service Analytics visual and give it the information it needs to create its own query. You might want to go this route if you really just need one visual based on its own query. |
Dependencies
The application framework depends upon jQuery. insightsoftware recommends that you link jQuery v1.8 or later.Accessing the Application Framework
Self-Service Analytics’s application framework is provided by linking thezoomdata-client.js file in your web application. You can find zoomdata-client.js on your installation at
<yourserver> with the URL for your server.
Best practice: Use the zoomdata-client.js file found on the Self-Service Analytics installation that will be supplying your data and visuals. There is not usually a problem using different versions, but following this guidance avoids such issues and may help Self-Service Analytics support your work.
Linking the zoomdata-client.js file into your web application gives you access to the ZoomdataSDK object. The main purpose of the ZoomdataSDK object is to create a Self-Service Analytics client for your application. Typically, one Self-Service Analytics client is enough, but if you need to access multiple Self-Service Analytics servers, you will need one client for each one.
Typical Workflows
There is a lot of flexibility with the application framework, but some steps must precede others. When steps must be kept in a particular order, the application framework uses promises to do so. Below is an example of the most common workflow.Typical Workflow to Query Data
This workflow creates a query and then queries data from it. This workflow is useful if you already have visuals in your application and you need to supply them with data from Self-Service Analytics. It’s also useful if you just want the data.- Create a Self-Service Analytics client. Steps to create a client are found in Use a Data Query.
- Create a Self-Service Analytics query.
- Run the Self-Service Analytics query.
- Gather and use the queried data.
Next Steps
It might be that you only need to embed a visual or use data from Self-Service Analytics in your own application. Consider the information at the following links:Use a Data Query
The Self-Service Analytics JavaScript client library provides functions to query the Self-Service Analytics server for data. This guide uses a method that does not provide event handling for the queries. To assist you in querying for data without handling events, Self-Service Analytics provides:- This topic, which includes annotated steps for using a query in your own web app.
How a Query Works
The Self-Service Analytics object is used to create a Self-Service Analytics client object. This client is then used to create a query object. To run the query, you pass it and a data processing function toclient.runQuery(). The client.runQuery() function retrieves data and passes it to the data processing function.
Steps for Using a Query in Your Web App
These high-level steps for using a query in a web application will guide your work.- Link Dependencies
- Organize Application and Security Parameters
- Configure the Query
- Code the Query
- Run the Query
- Find Your Data
Link Dependencies
Using Self-Service Analytics data queries depends on thezoomdata-client.js library. You can link to this library on your Self-Service Analytics server at composer/sdk/zoomdata-client.js.
The application framework and example code used in this topic also depend on jQuery (jQuery.js). Self-Service Analytics recommends that you link jQuery v1.8 or later. Your script must have access to this library to use the example.
Organize Application and Security Parameters
Connecting the webpage to your Self-Service Analytics server requires supplying the Self-Service Analytics server with application and security parameters in the form of JavaScript objects. These two objects are themselves bundled together as a single object to be passed to thecreateClient() method. For example:
Configure the Query
Before you can create a query, you must create a query configuration object. This object is used to create a query using the Self-Service Analytics client’s member functioncreateQuery(). For example, the query configuration object below gathers from its data source up to 200 productGroup items, sorting them in ascending order and measuring them by their average price, filtering out any groups whose average price is not less than 100.
Code the Query
ThecreateClient() and runQuery() functions are used to create and run a query. The runQuery() function returns a promise, so you can chain then() and done() functions to it.
To code a query:
-
Instantiate a Self-Service Analytics client if you do not already have one that you want to use.
-
Use the client’s
createQuery()method to create the query. The required parameters are a data source available to the client (based on the server it accesses and its permissions) and a query configuration object.
Run the Query
The Self-Service Analytics client library offers different ways to run the query to gather data. This tutorial uses theclient.runQuery() method, which applies a function to each data object resulting from the query. There is also a client.run() method, which returns a thread that contains both the data and other messages that are useful for working with data.
To run a query with client.runQuery():
-
Supply
runQuery()with these parameters:- a query, which you can create using the steps found in Coding a Query
- a function to execute on each object resulting from the query, which should take one parameter
-
Typically, you should chain a .catch() function to handle errors after the event handling function
runQuery() extracts a data object, rather than a single piece of data, from your query and passes it to your data processing function. For more information about finding the data you need in the returned data object, see Find Your Data.
Full Example
Find Your Data
TherunQuery() function returns a data object or more commonly an array of data objects. These objects each have the same structure, which can be predicted by the query configuration and also discovered programmatically.
Structure of the Data Object
Each data object consists of the following objects:-
current : an object that contains a count value and a metrics object
- count : indicates the number of rows of data represented in the data object
-
metrics : contains one object for each metric
- individual metric objects contain a key:value pair. The key is the operation of the metric, such as
'``avg``'or'min'. The value is the metric value, for example: - The current object above indicates that 131 rows of data are in the queried group, and have an average revenue of $23.32 and average profit of $13.16
- individual metric objects contain a key:value pair. The key is the operation of the metric, such as
-
group : an array listing the groups aggregated in the data object
-
for example
The groups object above represents rows of data that satisfy both grouping requirements:
'Gaithersburg'and'Coffee', which, depending on the data set, may represent sales of coffee in Gaithersburg.
-
for example
Isolate a Piece of Data Manually
If you know the structure of the query in advance, you can reliably anticipate the structure of the data object. The query returns metrics, groups, and fields in the order they are found in the query object. To verify the order, use aconsole.log() statement to output to the debugging console a sample data object returned by the query.
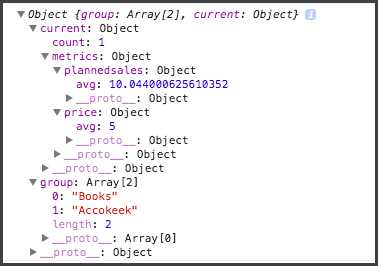
Isolate a Piece of Data Programmatically
You will not always know in advance which metrics, groups, and fields are involved in a data structure. The Query API provides accessor functions to identify programmatically the metrics, groups, and fields involved in a query. These functions are useful in the event that a query is subject to change at runtime. These accessors include:query['metrics'].get()query['groups'].get()query['fields'].get()
- Create an array with the names of metrics, groups, or fields
- Use the array to iterate through the returned data objects
-
Call query[‘metrics’].get() and assign the returned array to a variable.
-
Iterate through the returned array using its forEach() method. Pass to forEach() an anonymous function to extract the name of each metric and add it to an array of the purpose of storing only the names of metrics.
Configure Visuals Using Visualization Variables
When a visual is embedded into a custom application, it uses the default settings determined by the metrics and fields or groups present in the data query that supplies the visual with data. For more information about configuring and creating a data query, see Query Configuration Object or Use a Data Query. When embedding a visual, you also have the option of overriding default configurations by modifying the configuration of visual settings. You modify the default settings with thevariables key in the parameter passed to the visualize() method.
Before you can encode settings into an embedded visual, you must identify every required setting as well as any optional settings that you wish to use. Visual settings can be identified using an internal REST API method.
The REST API method used in these steps is considered internal to the Self-Service Analytics application. Internal APIs should not be used except as directed. For more information about using internal APIs, see Cautionary Note About Internal APIs.
Identify a Visual’s visualizationID
You can identify a Self-Service Analytics visual’s visualizationID while working with it. For example, to programmatically identify a visual’s default settings using a REST API call, you must have the visualizationID handy.
Identify a visual’s visualizationID
- Open the visual in its dashboard.
-
Find the number at the end of the URL in the address bar of your browser. The
visualizationIDis the section of the number after the plus sign (+).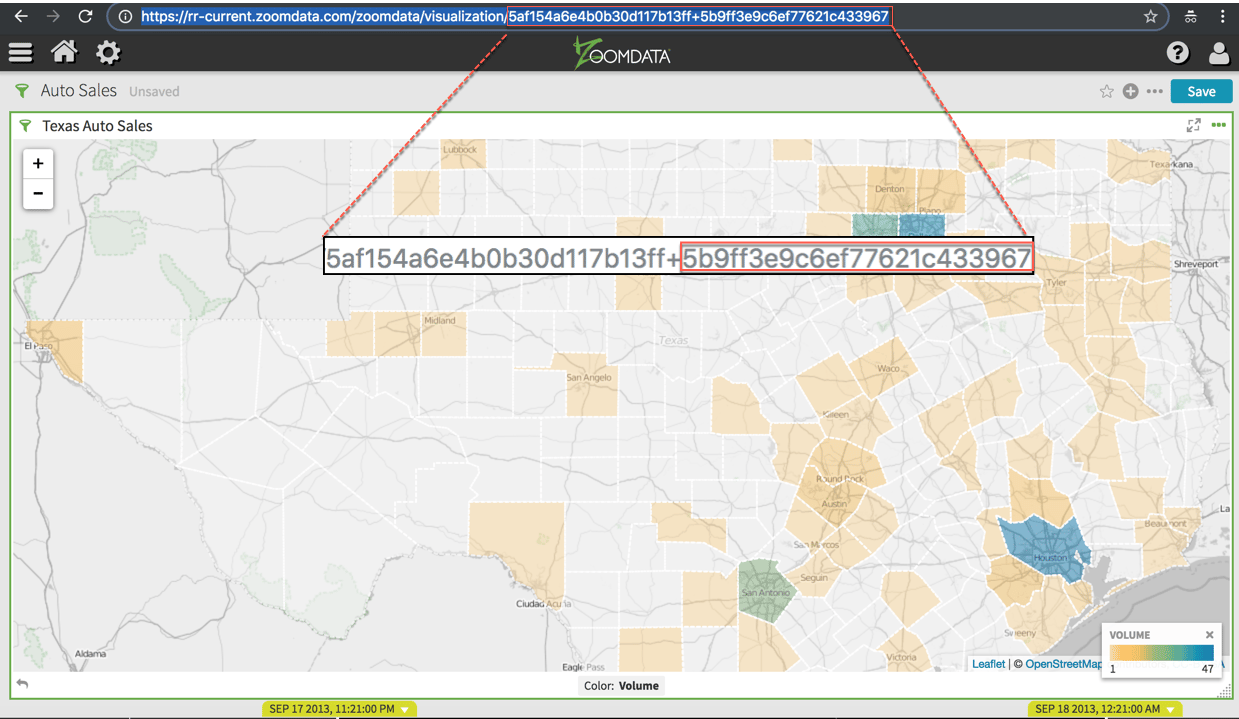
visualizationID of a visual, you can use it in other steps such as calling REST API methods.
Identify a Visual’s sourceID
You can identify a Self-Service Analytics visual’s sourceID while working with it. For example, to programmatically identify a visual’s default settings using a REST API call, it is easiest to use the sourceID in the call to look at its source configuration.
To identify the sourceID of a visual’s source:
- Open the visual in its dashboard.
-
Find the number at the end of the URL in the address bar of your browser. The
sourceIDis the section of the number before the plus sign (+).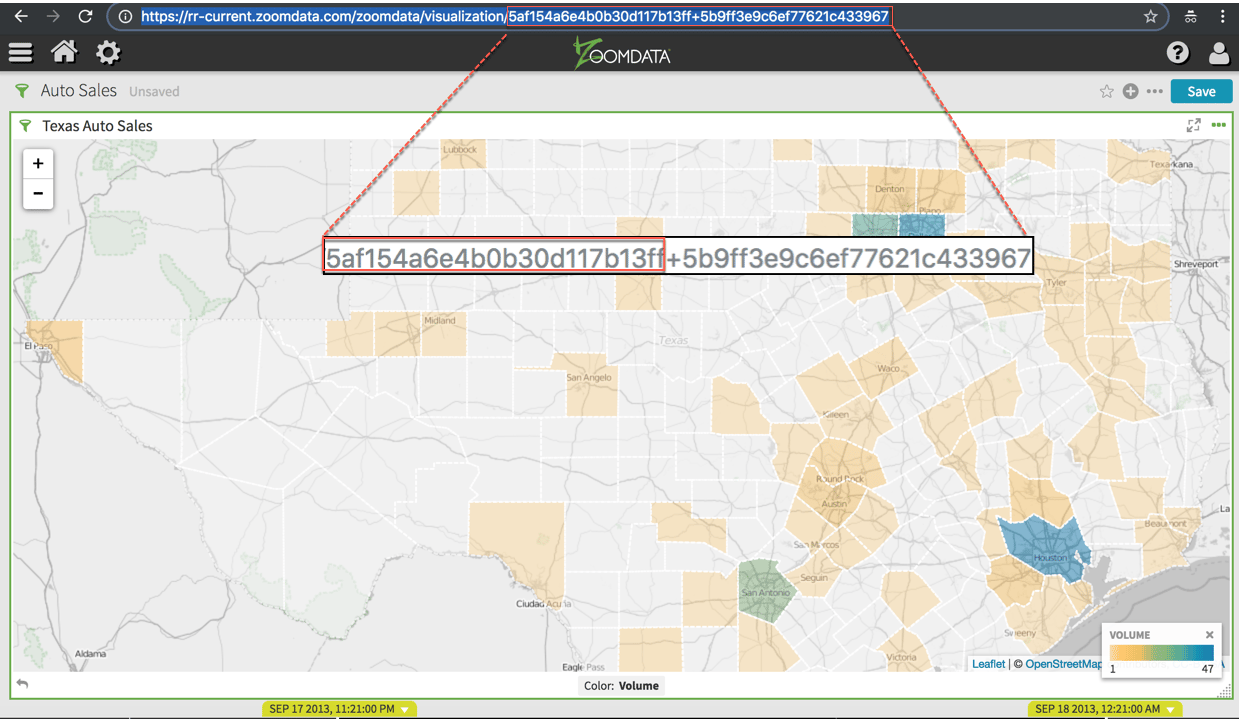
sourceID of a visual, you can use it in other steps such as calling REST API methods.
Query Configuration Object
The query configuration is contained in a JSON object including specific key:value pairs. You do not need to include unused keys. The exceptions are:- the
timekey, which must specify atimeFieldvalue if aplayeris to be used by the query - you must use one and only one of the following keys:
fields,groups, anddimensions. Using none or more than one of these keys results in an error.
filters, though it can be defined as[]if you do not want to apply any filtermetrics, without which the visual will not have data to present
Example
tz: ''
Sets the timezone used by the web app. Use ISO standard abbreviations. The value defaults to the Self-Service Analytics server time.
time: {}
A time object, which specifies the time range to be included in the query. Essentially, this parameter filters the query based on time using the time field, from, and to elements.
| Key | Usage | Notes | Examples |
|---|---|---|---|
timeField | String. Sets the field to be used as the time measurement. | This field refers to the data source columns containing the time measurement, rather than any label that appears in the user interface. | |
from | String. Sets the earliest time from which data should be included in the query. | Use the format [-/+]YYYY-MM-DD HH:mm:ss.SSS (preceded by a + or - to include or exclude the specified time). | +2024-10-23 10:30:15.500 to start at 23 October 2024 10:30:15.5, inclusive |
to | String. Sets the latest time to which data should be included in the query. | Use the format [-/+]YYYY-MM-DD HH:mm:ss.SSS (preceded by a + or - to include or exclude the specified time). | -2025-01-10 10:30:15.500 to start at 10 January 2025 10:30:15.5, exclusive. |
player: {}
A player object, which specifies parameters for retrieving data from a source. It consists of the speed, pauseAfterRead, and timeWindowScale elements. If you include a player object in the query, you must also include a time object that includes at least the timeField element.
| Key | Usage | Notes | Examples |
|---|---|---|---|
speed | Integer. Sets the interval at which data should be retrieved, in seconds. | Accepted values are: 1 (every second), 60 (every minute), 3600 (every hour), and 86400 (daily). | 60 |
pauseAfterRead | Boolean. Sets whether the data stream, if applicable, should be paused after initial retrieval. | data set empty message may result when pauseAfterRead is set to false with a non-live data source. | true |
timeWindowScale | String.'ROLLING' or 'PINNED'. Sets whether the time interval of retrieved data “rolls” or stays “pinned” to its original starting point (the from element of the time object). | The retrieval of a rolling time window starts at the point where the last retrieval finished. The retrieval of a pinned time window always starts at the same point, which is provided by the from element. The image below shows rolling time windows above the timeline, and pinned windows beneath it.  | 'ROLLING''PINNED' |
filters: [{},{}]
Array of filter objects. Filter objects are applied to the data query using logical-and operations so that data is passed from the data query only if it satisfies all applied filters. Each filter consists of a path, an operation, and a value.
| Key | Usage | Notes | Examples | ||||||||||||||||||||||||||||
|---|---|---|---|---|---|---|---|---|---|---|---|---|---|---|---|---|---|---|---|---|---|---|---|---|---|---|---|---|---|---|---|
path | String. The name of the group or metric on which the filter operates. | This name is that of the data source column containing the group or metric of the filter, rather than the label that appears in the user interface. | customer_gendercustomer_ageuser_occupation | ||||||||||||||||||||||||||||
operation | String. The logical operator used by the filter. | Valid options include the following:
| 'EQUALSI''BETWEEN''NOTIN' | ||||||||||||||||||||||||||||
value | Single value or array of values. The value(s) considered by the logical operation. | If two or more values are needed, such as for a logical set or for a ‘BETWEEN’ operation, they should be provided in an array. Single values, such as required for an ‘EQUALS’ or ‘LT’ operation, should be provided as simple values. | 'female' [21,65]['teacher','lawyer', 'plumber'] |
groups: [{},{}]
Array of group objects. Group objects specify which data is returned by a query and how it is grouped. Each group object has a name, limit, and a sort object.
If
groups is defined, fields and dimensions must be omitted.| Key | Usage | Notes | Examples |
|---|---|---|---|
name | String. The name of the attribute to be used for grouping data. | This name is the name of the data source column containing the attribute, rather than the label that appears in the user interface. | 'home_state' |
limit | The maximum number of distinct items to be included in the data set. | If the limit is set lower than the total number of items in a group, not all members of the group will be included in the returned data set. For example, if the limit is set to 25, then the group us_state could not return data from all fifty US states. | 50 |
sort | A sort object. See below. | {dir: 'desc', name: 'home_state'} |
sort: {}
A sort object. Sort objects describe the way in which a group is ordered. Each sort object consists of the name of the group or metric for the sorting and the direction in which the group’s data is sorted.
| Key | Usage | Notes | Examples |
|---|---|---|---|
name | String. The name of the group or metric on which the filter operates. | This name is that of the data source column containing the group or metric by which groups are to be sorted, rather than the label that appears in the user interface. | 'home_state' |
dir | String. The direction of the sorting. | Valid options are 'asc' and 'desc' for ascending and descending sorts, respectively. | 'asc' |
metricFunc | String. Required to sort by a metric value. Not permitted if you sort by count or by a group. | Valid options include the following:'min', 'max', 'avg', 'sum', 'calc', 'distinct_count', 'last_value', 'percentiles' | 'sum' |
fields: [{},{}]
Array of field objects. A field object is used to take a whole column of data without grouping it by the items found in the column. Each field object consists of the name of a column.
If
fields is defined, groups and dimensions must be omitted.metrics: [{},{}]
Array of metric objects. Each metric object indicates a column to be returned and used by the data query as a metric. Each metric object can have a name and function.
| Key | Usage | Notes | Examples |
|---|---|---|---|
name | String. The name of the metric. | This name is that of the data source column containing the metric, rather than the label that appears in the user interface. | 'user_age' |
function | String. Determines the function applied to the metric. | Valid options include the following:'min', 'max', 'avg', 'sum', 'calc', 'distinct_count', 'last_value', 'percentiles' | 'avg' |
Application Configuration Object
The application configuration object contains the parameters that your client needs to identify a Self-Service Analytics server.Example
- secure: true to use HTTPS (secure) protocol, otherwise
false - host: the base URL where your Self-Service Analytics server is hosted
- port: the port that your Self-Service Analytics uses to communicate; by default, this is
8443 - path: the path from your base URL for your Self-Service Analytics server; by default, this is
‘/zoomdata’
Security Configuration Object
The security configuration object contains the required access token you generate for your client to access Self-Service Analytics.insightsoftware recommends using Trusted Access for all embed-related workflows.
Example
- access_token: Trusted access token for accessing the Self-Service Analytics server. See Generate a User’s Access Token. The client created should have credentials matching those used to create the trusted access token.
Events Created by Client
Thread Events
Visualization Events
Self-Service Analytics Visual Metrics and Attributes Reference
Different visual types support different numbers of metrics and attributes and have different metric identifiers. The table below lists these for each visual type available.| Icon | Visual Type | Number of Metrics | Metric Identifiers | Number of Attributes |
|---|---|---|---|---|
 | Single Metric Visuals | at least 1 | Arc color | none |
 | Bar, Line, and Combo Charts | at least 1 | Bar height, bar color, segment size, color | at least 1 |
 | Bars: Histograms | 1 | Bar height, bar color | 1 |
 | Bars: Multiple Metric Charts | Multiple | Bar height, bar color | 1 |
 | Box Plots | 2 | Position and size | 1 |
 | Bullet Gauges | 1 | Bar length | 1 |
 | Combo Charts | 2-4; at least 2 | Bar or line color; additional y-axes on right | 1 |
 | Donut Charts | 1 | Segment size, color | 1 |
 | Floating Bubble Charts | 2 | Position and size | 2 |
 | Heat Maps | 1 | Segment color | 2 |
 | KPI Charts | 1 | Segment color | |
 | Edit Line & Bar Trend Charts | 2 | Bar color | time |
 | Line Trend: Attribute Value Charts | 1 | Point location | 2 and time field |
 | Line Trend: Multiple Metric Charts | Multiple | Point location | 1 |
 | List Filter Visuals | Only one field can be selected for a list filter visual. | ||
 | Marker Maps | 2 | Color | 1 |
 | US Region Maps | 3 | Color | 1 |
 | World Maps | 1 | Color | 1 |
 | Packed Bubble Charts | 2 | Bubble size, bubble color | 1 |
 | Circular, Tree, and Cloud Visuals | 1 | Segment size, color | 1 |
 | Pivot Tables | Multiple | Multiple | |
 | Tables | Multiple | Multiple | |
 | Comparison and Relationship Charts | 3 | Position and size | 1 |
 | Sunburst | 3-4 | Segment size, color | 1 |
 | Tree Maps | 2 | Segment size, color | 1 |
 | Waterfall | 2 or more | Size, Color | at least 1 |
 | Word Clouds | 2 | Font size, color | 1 |