You must be an administrator to manage custom visual types.
- Part 1: Custom Chart Basics
- Part 2: Query Variables, Chart Defaults, Data Preview, and Data Accessors
- Part 3: Third-Party Charting Library Integration
- Part 4: Custom Chart Controls
Part 1: Custom Chart Basics
This part of the custom chart tutorial introduces you to the Custom Chart CLI, how to create a chart with sample code, how to edit the chart’s code, and how to preview the chart. The following steps are performed in Part 1:- Step 1. Check Your Development Environment
- Step 2. Install & Configure the Custom Chart CLI
- Step 3. Create a Custom Chart with Sample Code
- Step 4. Edit the Chart Code
- Step 5. Preview the Chart
Step 1. Check Your Development Environment
Verify that you have everything set up to start creating custom charts with Self-Service Analytics.- A valid version of
node.jsmust be installed.Node.jsis a programming tool for running JavaScript on servers and in your computer’s terminal. The Self-Service Analytics custom chart CLI is built usingnode.js. - A valid version of
npmmust be installed. It is usually installed withnode.js. - Self-Service Analytics 26.3 or later must be installed.
- Open a terminal window on your computer.
- Enter
node --versionin the terminal window. The version ofnode.jsinstalled on your computer is shown in the window. The minimum supported version ofnode.jsby the Self-Service Analytics custom chart CLI is version 10. - Enter
npm --versionin the terminal window. The version of npm installed on your computer is shown in the window. The minimum supported version ofnpmsupported by the Logi Composer custom chart CLI (composer-chart-cli) for Self-Service Analytics is version 1.
node.js and npm are not installed, go to https://nodejs.org/ and install the recommended version for your operating system.
Step 2. Install & Configure the Custom Chart CLI
Self-Service Analytics uses the custom chart CLI to build, edit, and remove custom charts. Install and configure the CLI-
Enter the following command in the terminal window.
-
After the CLI is installed, enter the following command in the terminal window:
-
The
configcommand prompts you to supply the following information:- Your Self-Service Analytics server URL.
-
The user name to use for authentication (typically:
admin).You must be an administrator to manage custom visual types. - The password for the user name.
-
After entering this information, a prompt asks whether the configuration content should be stored in an encrypted file residing in your home directory (
~/.config/composer/cmp-chart.pref). Enter y to finish configuring your environment. -
Verify that everything is set up correctly by listing the custom charts available on the configured server using the following command:
If your Self-Service Analytics instance does not have any custom charts defined, the output of this command is an empty list. If your instance does have custom charts defined, verify that they are correctly listed in the terminal window.
Step 3. Create a Custom Chart with Sample Code
You can specify one of three chart types to get you started:- Single Group
- Multigroup
- Raw
-
Enter the following command in the terminal window:
-
The
initcommand creates a directory in the specified path containing the files you need to get started. Here is a preview of the directory tree: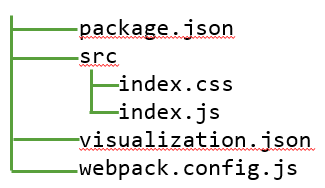
-
Install the default
devDependencieslisted in thepackage.jsonfile. This step is required before you can work with the chart’s code. In a terminal window,cdto your chart’s root directory and run the following command: -
To use a similar naming convention as the out-of-the-box charts, update the chart’s name in the
visualization.jsonfile to “My First Custom Chart”. Save the file.
Step 4. Edit the Chart Code
Self-Service Analytics’s custom charts are comprised of CSS and JS files that make up the chart’s code. The chart CLI lets you update the chart’s code in the server in one of two ways:- You can push an updated local copy of the chart back to the server.
- You can use watch mode to continuously check for changes to the local component files and automatically update your Self-Service Analytics server’s copy.
-
Compile a development version of the chart’s code using the webpack bundler. In the terminal window from the root directory of the chart, enter the following command:
-
In a different terminal window, push the chart for the first time to the configured server:
-
Set up watch mode to continuously update the chart on the Self-Service Analytics server as the code changes. Enter the following command in the second terminal window:
The
npm startcommand instructs webpack to compile the code into a singlevisualization.jsfile and continuously watches for changes in thesrcfiles to update the chart as necessary. Thecmp-chart watchcommand running in a separate terminal window starts watching for changes in thevisualization.jsonandvisualization.jsfiles to push the chart changes back to the server. -
Open the
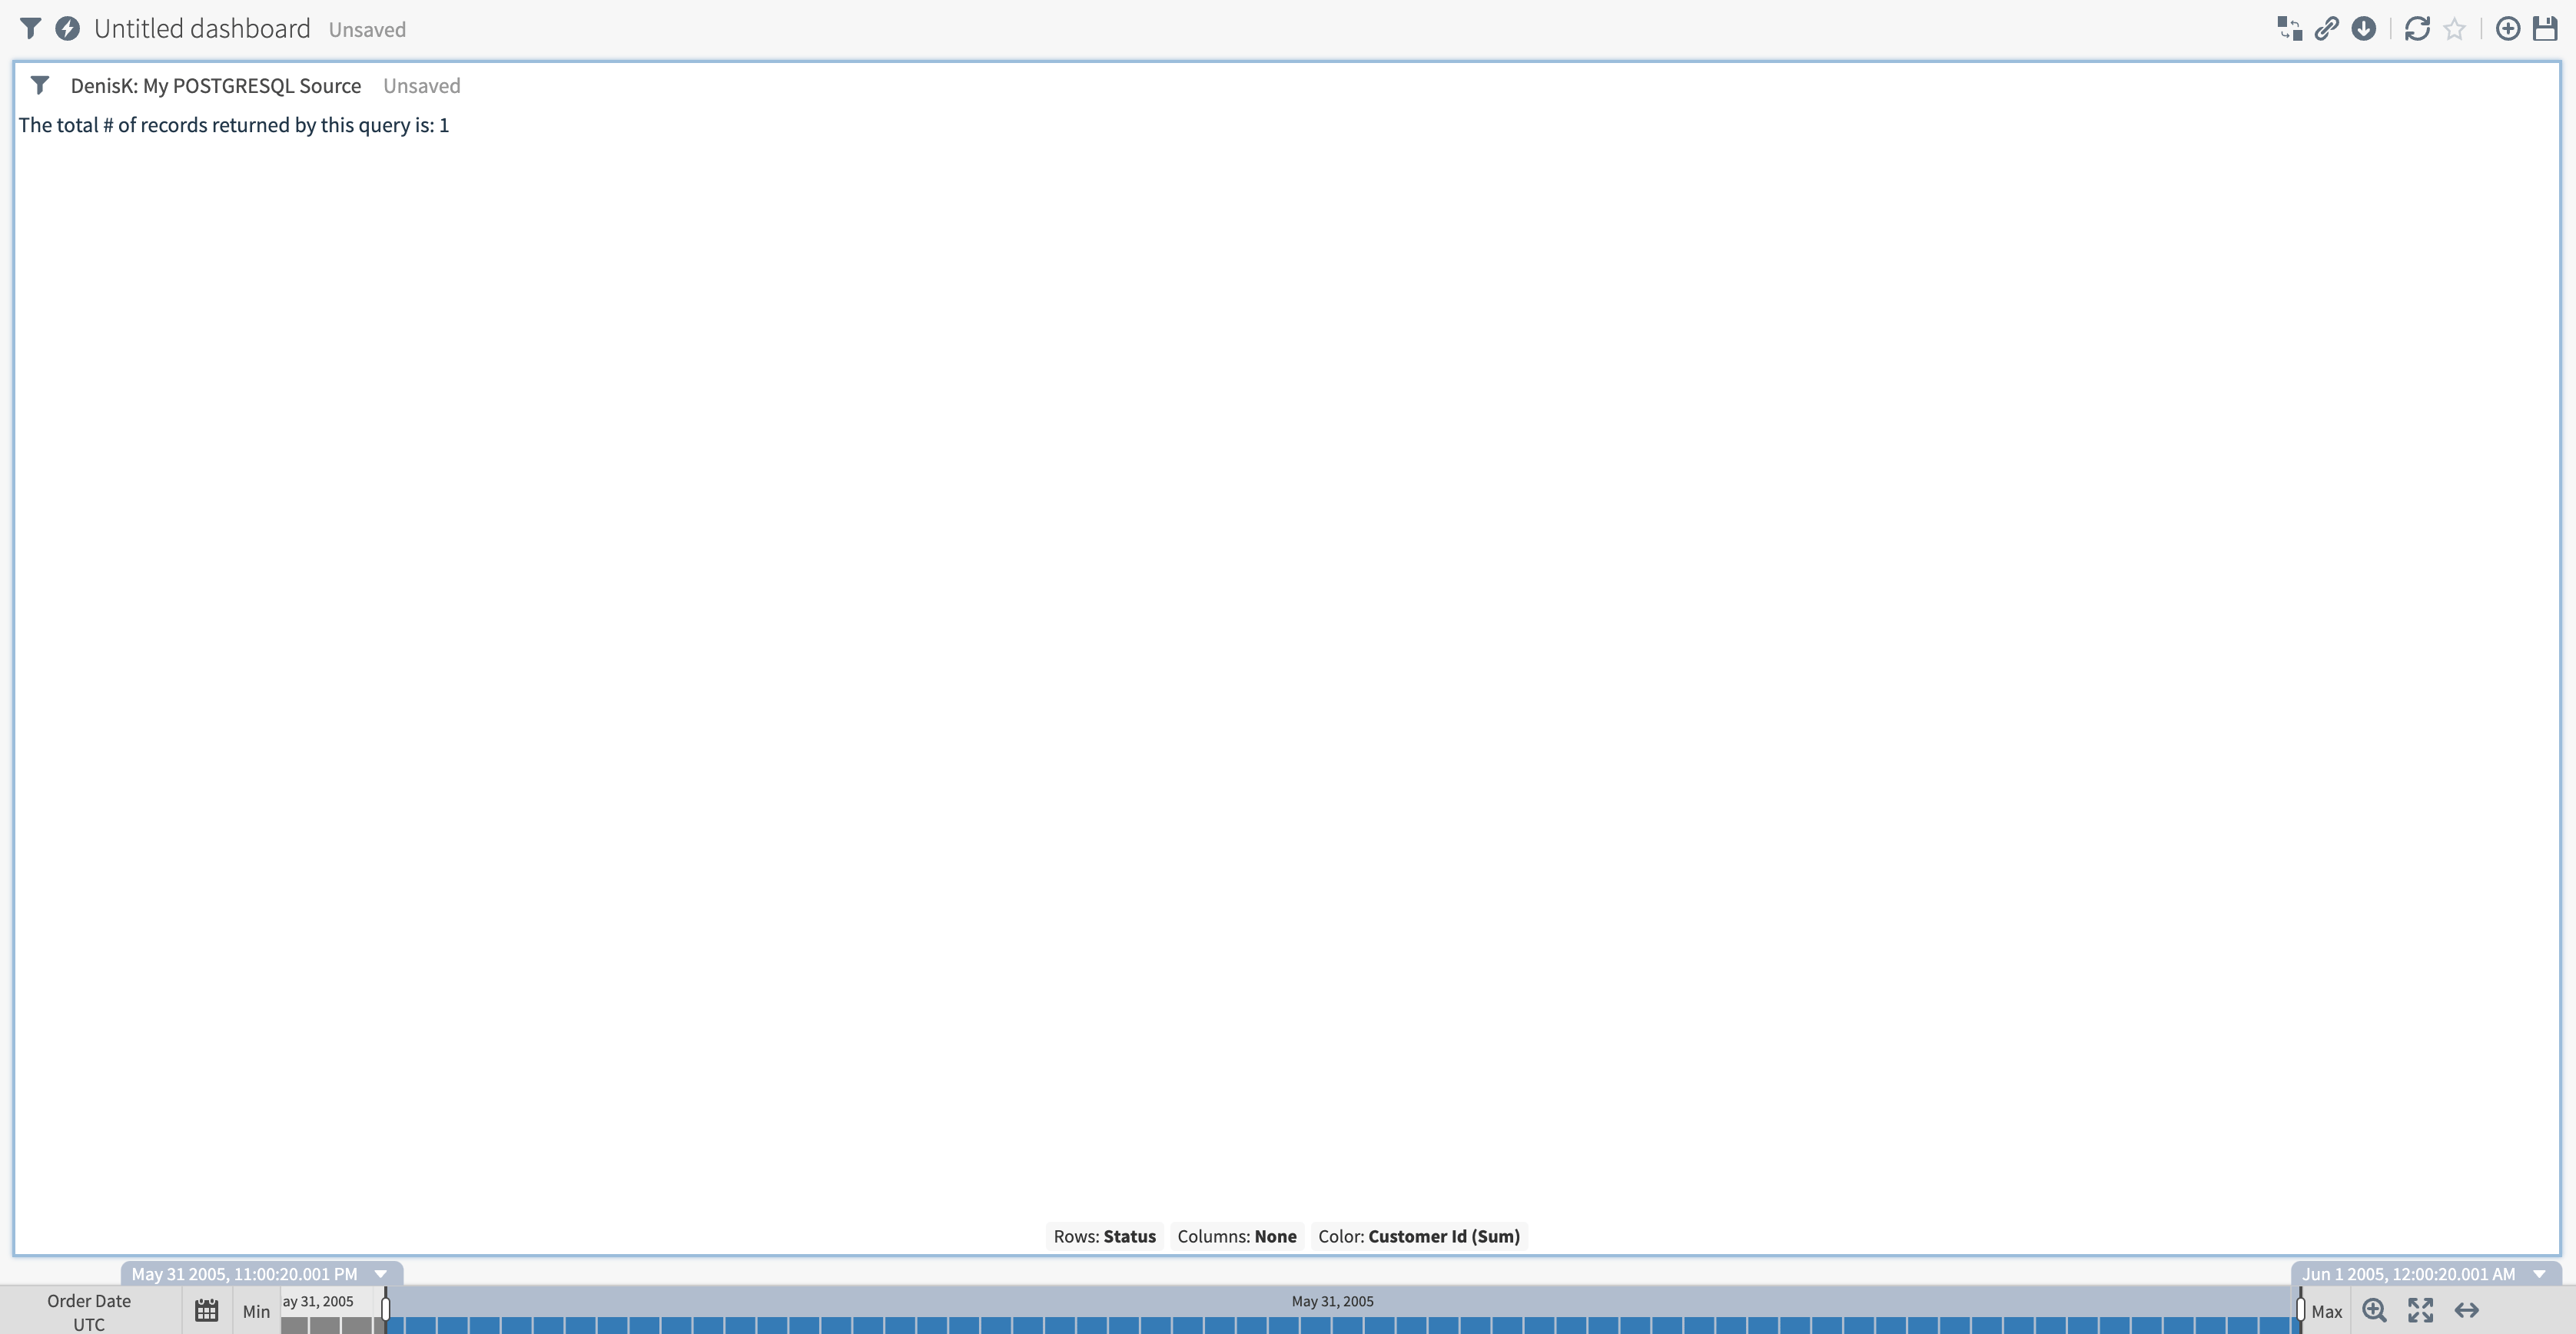
src/index.jsfile in your preferred text editor or integrated development environment. Modify the code to output some text on the chart with the total number of records returned by the default query. Change thecontroller.updatefunction in thesrc/index.jsfile to contain the code below: - Return to the terminal window where watch mode is enabled. A message showing that the My First Custom Chart was updated should appear.
Step 5. Preview the Chart
Before you can preview the newly created chart in a dashboard in the Self-Service Analytics UI, you must enable it for a specific source.- Log into the Self-Service Analytics UI as an administrator or a user with the Administer Sources privilege.
- Select the Sources card on your home page or Data Sources from the main menu. The Sources page appears.
- On the Sources page, locate a data source configuration to edit, and select the More icon in the Actions column.
- Select Available Visual Types. The Available Visual Types work area for this source opens.
- Select the chart named “My First Custom Chart” and enable (toggle on) the custom chart in this data source. A message appears, confirming “My First Custom Chart” is enabled.
- When your changes are complete, close the Available Visual Types work area.
- Log into Self-Service Analytics as an administrator or a user who has been assigned to a group with the Administer Dashboards privilege.
- Select the Discovery Board card on your home page or Library from the main menu. The library displays.
-
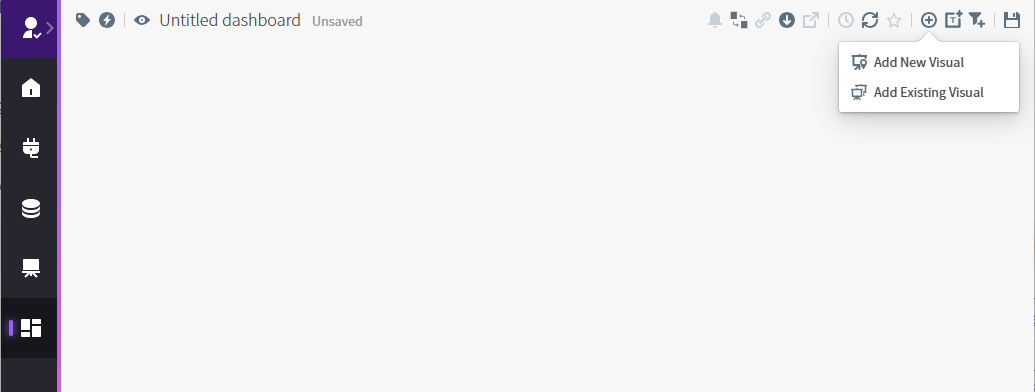
Select Add Dashboard. A blank dashboard appears showing options to add a new visual or existing visual.
-
Select Add Visual to add a new visual to the dashboard. Select Add Existing Visual to place an existing visual on the dashboard.
- If you select Add Visual, follow the procedure described in Manage Visuals
- If you select Add Existing Visual, follow the procedure described in Add Existing Visuals to a Dashboard.
- On the Step 1 of 2: Select a Source dialog, select the data source in which you enabled your custom chart. The Select a Visual Type dialog appears.
- Select your custom visual type (“My First Custom Chart”) on the Step 2 of 2: Select Visual Type dialog. The visual is created and added to the dashboard.