
- Review all Self-Service Analytics microservices and their log files.
- Produce a diagnostics bundle to send to insightsoftware Support.
- Set the logging level and properties for each microservice.
Contact insightsoftware Support for assistance with the installation and use of the Service Monitor.
Prerequisites
- Self-Service Analytics and its microservices must be version 3.5 or later.
- All microservices must have service discovery enabled.
- The Self-Service Analytics Service Monitor must be manually installed, configured and started.
- Install and Configure the Self-Service Analytics Service Monitor
- Access the Self-Service Analytics Service Monitor
- Service Monitor Views
- Download the Diagnostics Bundle
- Maintain Application Properties
Access the Self-Service Analytics Service Monitor
After installing the Service Monitor and restarting its microservice, you can navigate to its UI in a web browser using default port 8050. For example, if running locally, the Self-Service Analytics instance would be http://localhost:8080, so the Service Monitor URL would be http://localhost:8050. If your Self-Service Analytics instance is IP address URL 10.2.3.24, the Service Monitor URL would be http://10.2.3.24:8050. The user ID and password you should use to log into the Service Monitor are defined in properties you set up during the Service Monitor installation. See Install and Configure the Self-Service Analytics Service Monitor.Service Monitor Views
The Self-Service Analytics Service Monitor UI includes the following views, each accessible via a menu option in the main menu on the Service Monitor UI page:
Wallboard View
The Wallboard view provides shows all the Self-Service Analytics microservice types used in your installation. You can access it by selecting the Wallboard menu option.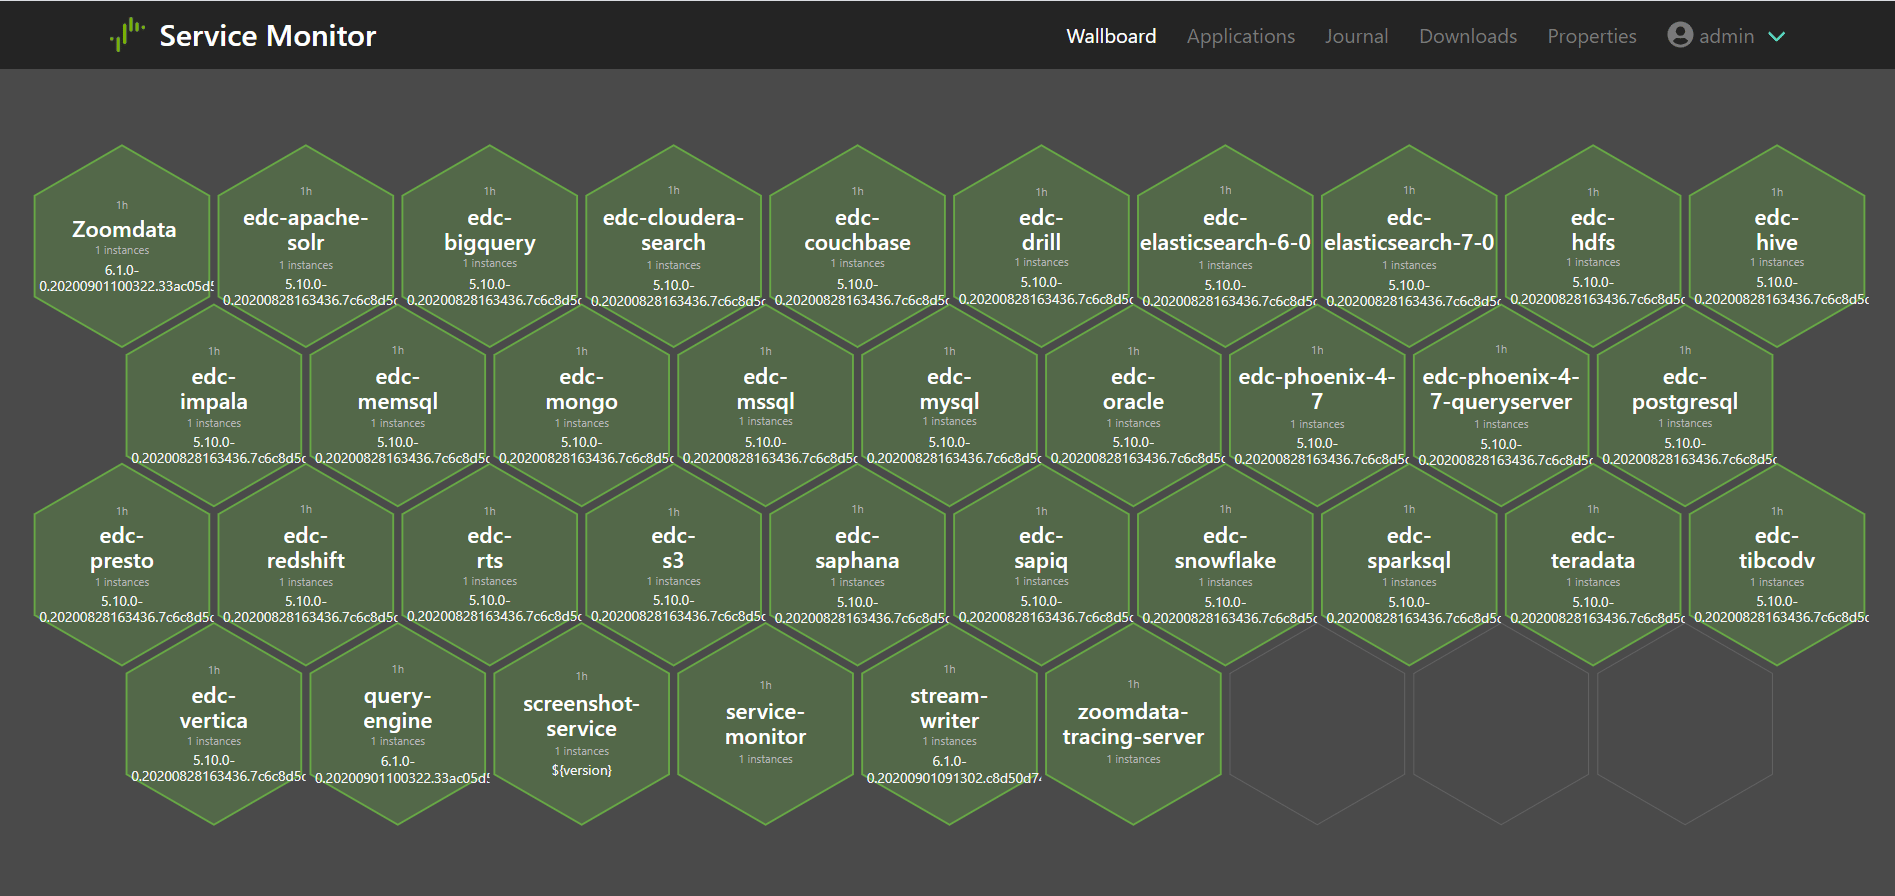
Applications View
Select Applications to access the Applications view.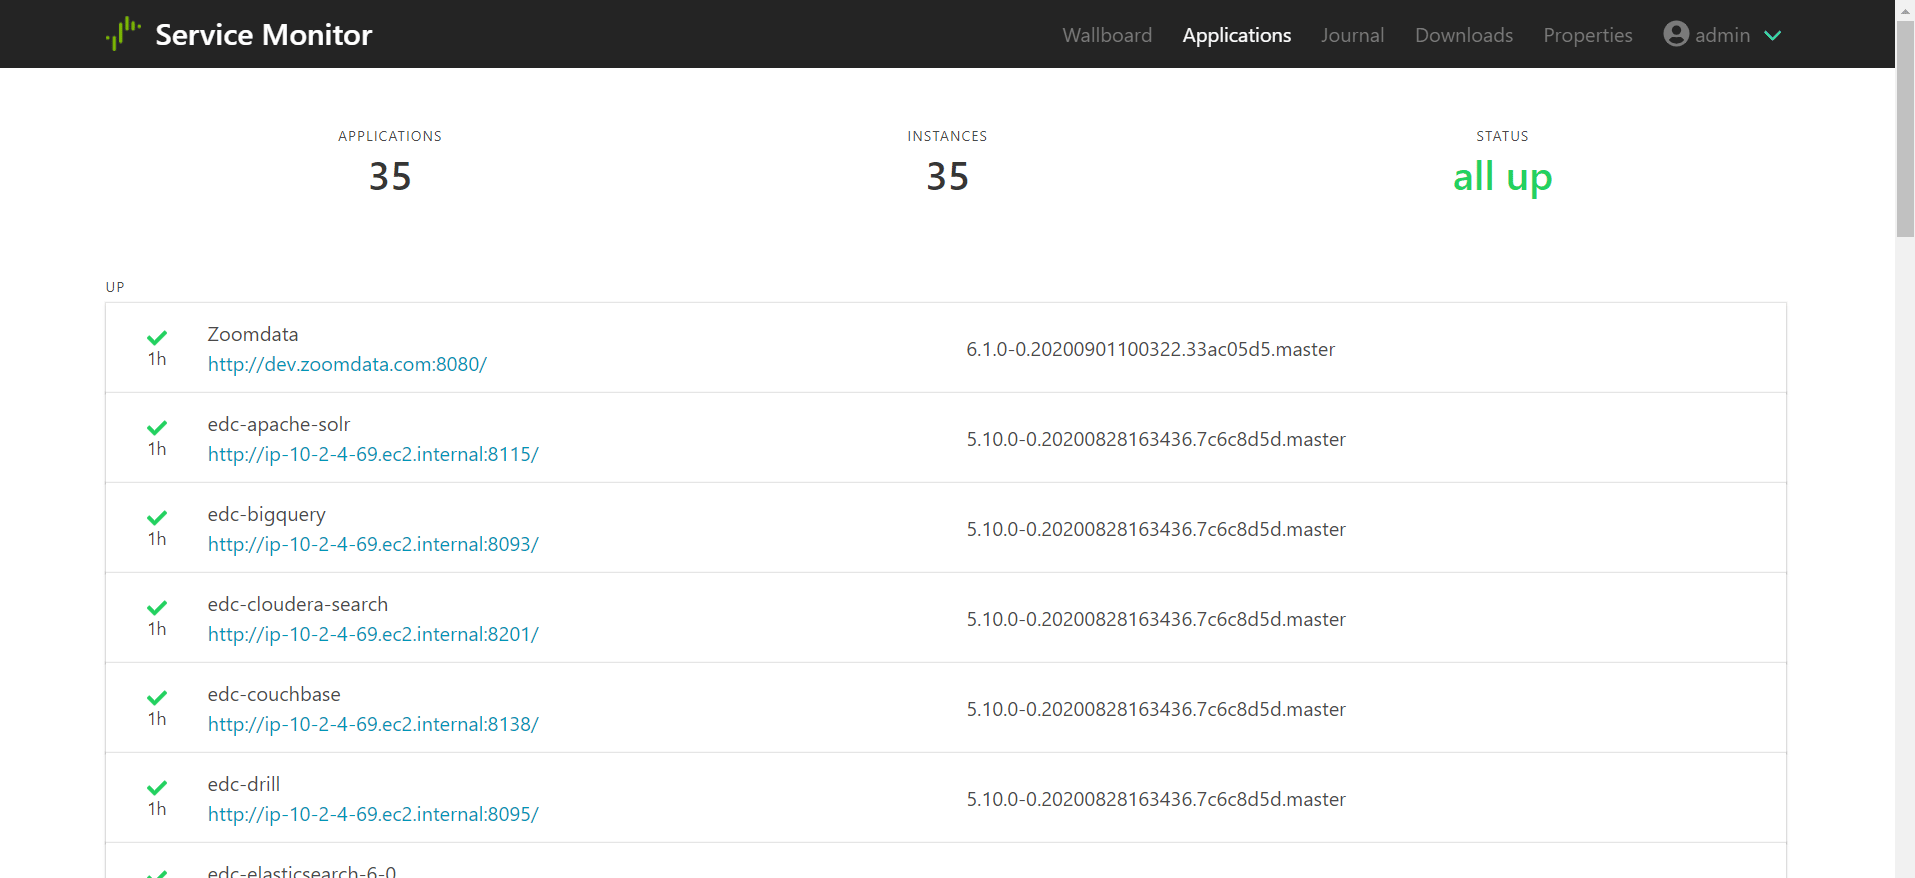
Journal View
Select Journal to access the Journal view.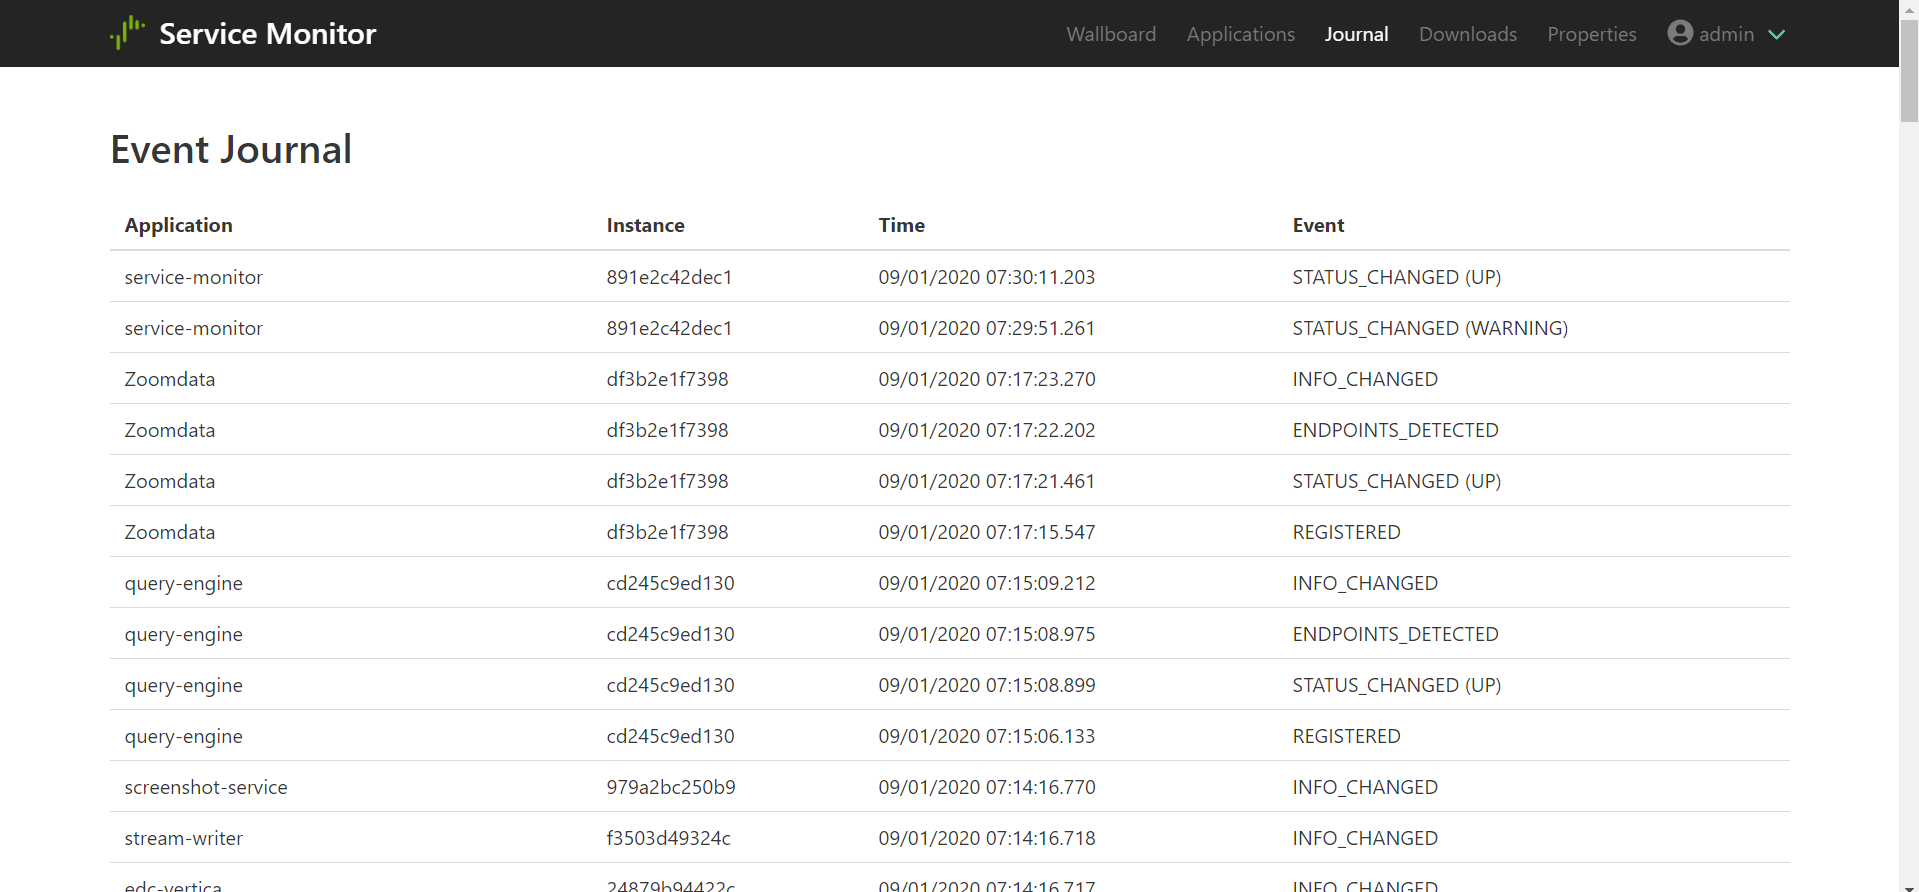
Downloads View
Select Downloads to access the Downloads view.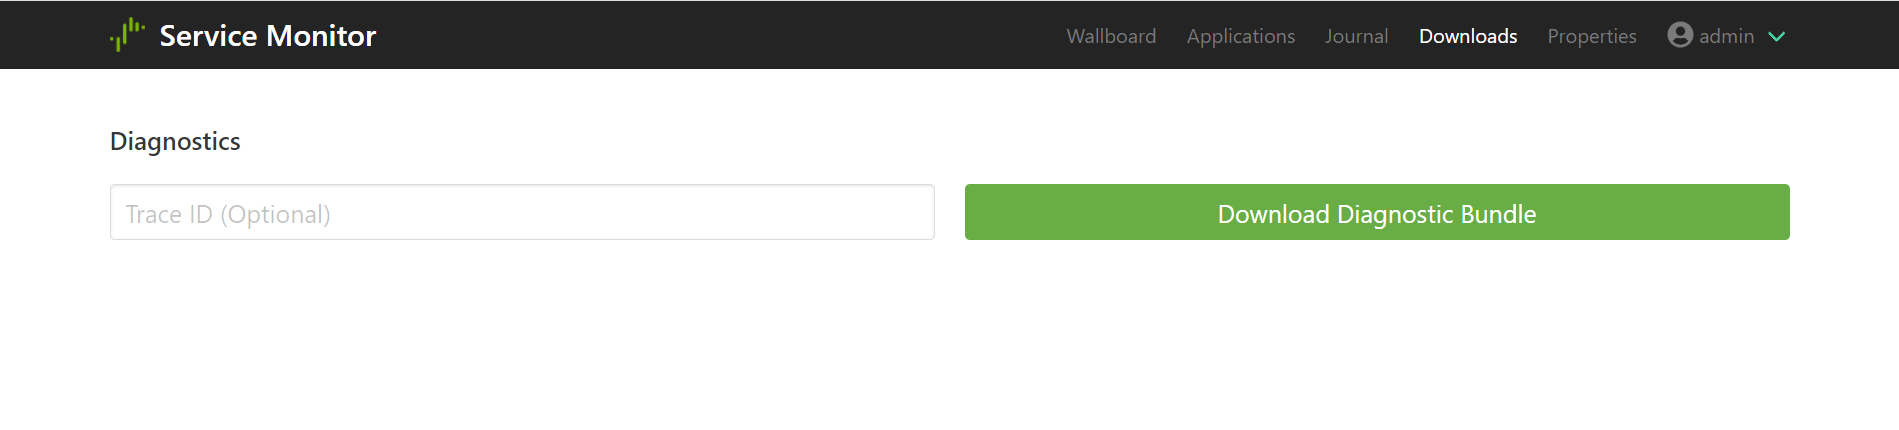
Properties View
Select Properties to access the Properties view. This view allows you to review and maintain the properties for each of the other Self-Service Analytics microservices. It requires that the Self-Service Analytics configuration microservice be installed and started first. See Maintain Application Properties.Install and Configure the Self-Service Analytics Service Monitor
The Self-Service Analytics Service Monitor microservice is not installed as part of a default Self-Service Analytics installation. The microservice name iszoomdata-admin-server.
If you are installing Self-Service Analytics in a Windows environment, you can install the Service Monitor as part of running the initial bootstrap script. See Install Self-Service Analytics - Windows and Windows Bootstrap Reference.
- Open your SSH client.
-
Use the following command to install the Self-Service Analytics Service Monitor in a CentOS environment:
Use the following command to install the Self-Service Analytics Service Monitor in an Ubuntu environment:
-
After the Service Monitor is installed, you must specify a user name and password in its properties file. The properties file is called
admin-server.propertiesand can be found in the/etc/zoomdata/directory (Linux) or the<install-path>/conf-modify/directory (Windows). If the properties file is not there, create it. The properties that must be defined are:monitor.user.name=<username>monitor.user.password=<password>
<username>and its associated password for<password>. The user name and password can be any user name and password you want. When you have finished, save the file. -
Add the following properties to the
zoomdata.propertiesfile, located in the/etc/zoomdatadirectory (Linux) or the<install-path>/conf-modify/(Windows). These properties ensure that the Service Monitor has access to the Self-Service Analytics server actuator endpoints.actuator.user.name=<composer-admin-username>actuator.user.password=<composer-pswd>actuator.logging.external-file=<log-file-path>
<composer-admin-username>and<composer-pswd>. If the default Self-Service Analytics log file path is not used for your installation, substitute your custom log file path for<log-file-path>. The default log file path is/opt/zoomdata/logs/zoomdata.logfor Linux and<install-path>/logs/zoomdata.logfor Windows.When finished, save the file.Setting these properties exposes valid Self-Service Analytics credentials as plain text in both the properties file and as tags in the Self-Service Analytics Consul. Anyone in your network with the ability to communicate directly with the Consul API or view the Consul UI will be able to see these values. -
Start the microservice. For example, use the following command to start the Self-Service Analytics Service Monitor using
systemdin a CentOS or Ubuntu environment:See also Start Microservices.
Maintain Application Properties
After the Self-Service Analytics configuration microservice has been configured and started, you can use the Properties tab in the Service Monitor to maintain the configuration properties of Self-Service Analytics’s other microservices. For information about specific Self-Service Analytics properties and property files, see Configuration Property Files. Maintain configuration properties using the Service Monitor- Using a web browser, navigate to the Service Monitor for the Self-Service Analytics instance. Its default port is 8050. For example, if running locally, the Self-Service Analytics instance would be http://localhost:8080, so the Service Monitor URL would be http://localhost:8050. If your Self-Service Analytics instance is at IP address 10.2.3.24, the Service Monitor URL would be http://10.2.3.24:8050. A login screen will appear.
- Log into the Service Monitor using the Service Monitor user name and password you defined when the Service Monitor was installed. See Install and Configure the Self-Service Analytics Service Monitor.
-
Select Properties on the main menu bar.
-
Select a Self-Service Analytics microservice in the Service drop-down list. The properties for the microservice are listed. The screenshot above lists all the properties in the
zoomdata.propertiesfile used by thezoomdatamicroservice. See Self-Service Analytics Microservice Name Reference for a list of Self-Service Analytics’s microservices. If a microservice is not listed in the Service drop-down list, that Self-Service Analytics microservice is not yet set up to use the configuration server or the microservice is down. -
Locate the microservice property in the list that you want to change.
- The list of properties can be sorted alphabetically by key or value. Select the Key or Value list heading to sort the properties in ascending or descending order.
- You can locate a property in the list by typing all or part of its name in the Search box at the top of the page.
-
Change the value of the property in the Value box associated with the microservice property you located.
See Configuration Property Files for a list of the property files and links to descriptions of the properties for which changes are approved.Be careful changing properties. Some properties should not be changed, except with the help of Self-Service Analytics Technical Support. The results of property changes could be unpredictable, if they are not made correctly.
- Select Save Properties to save your property changes.
- Select Apply Updates to apply the property changes to your running Self-Service Analytics instance. Self-Service Analytics dynamically stops and restarts the appropriate Self-Service Analytics microservices.
Use the Configuration Microservice to Maintain Application Properties
You can use the Service Monitor to review and maintain the properties for each of the other Self-Service Analytics microservices. It provides a centralized location where Self-Service Analytics configuration properties can be maintained. However, it requires that the Self-Service Analytics configuration microservice be configured and started first. The Self-Service Analytics configuration microservice is packaged with the Spring Cloud Configuration server, which allows Self-Service Analytics to easily integrate with its Spring-based microservices and provides the mechanism by which Self-Service Analytics property settings can be persisted in a supported PostgreSQL metastore or in a GitHub repository. The following diagram depicts this relationship.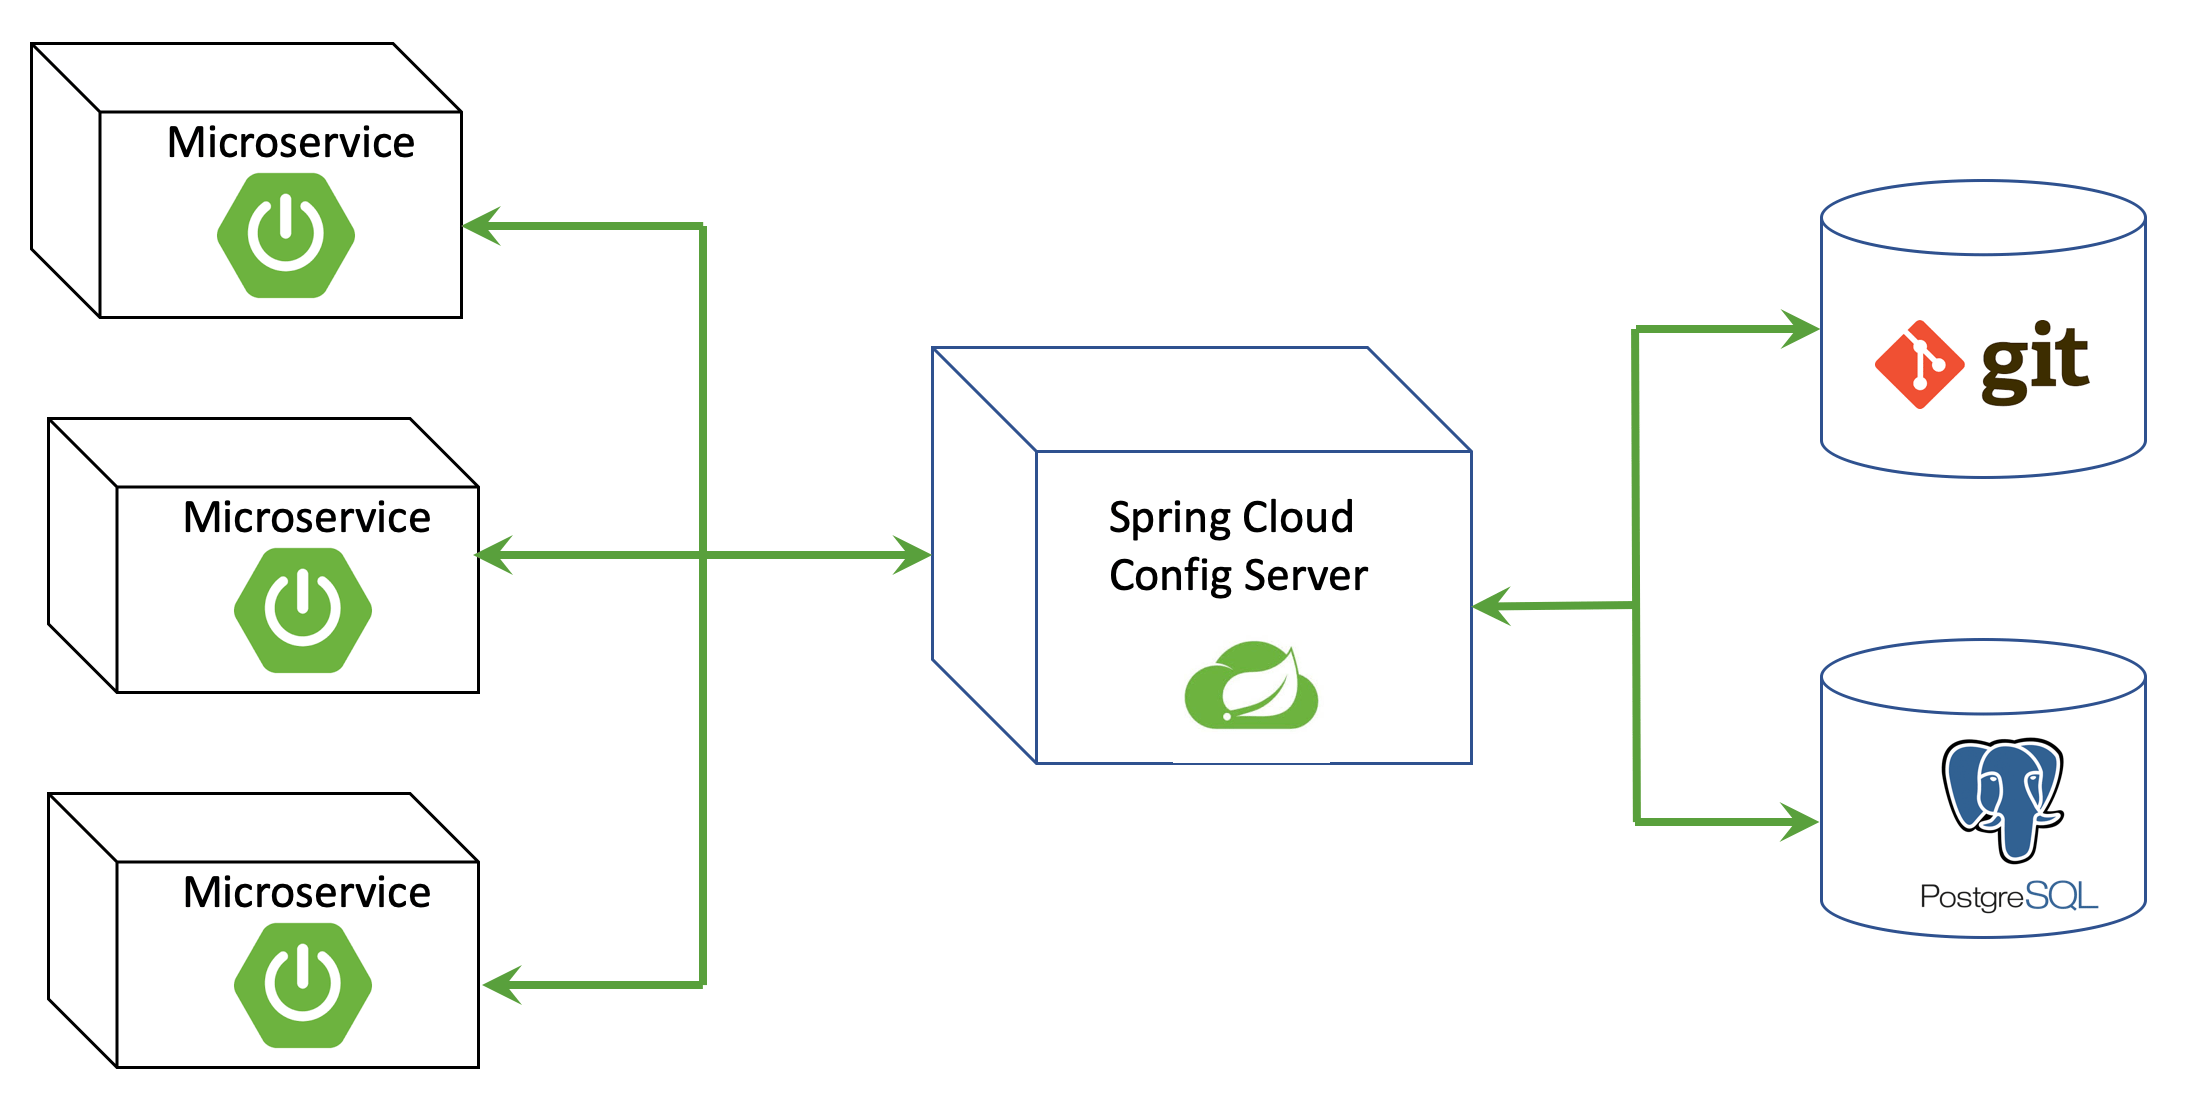
config-server-upload.jar utility is provided that can be used to migrate the microservice properties from your standalone Self-Service Analytics servers to the Self-Service Analytics configuration data in the high availability PostgreSQL data store, where the configuration microservice can maintain them. For more information see Migrate Properties to the Configuration Server.
See the following topics:
- Set Up the Configuration Microservice Metadata Store or Repository
- Configure and Start the Configuration Microservice
- Maintain Application Properties
Configure and Start the Configuration Microservice
Install, configure, and start the Self-Service Analytics configuration microservice- Verify that you have set up a PostgreSQL metastore or a GitHub repository to store the property metadata. See Set Up the Configuration Microservice Metadata Store or Repository.
- Open the SSH client associated with your instance.
-
Configure all installed and enabled microservices to use the configuration microservice. Run the following script:
-
Each microservice supports two configuration properties related to the configuration microservice:
config-server.enabled: Enables or disables integration with the configuration microservice. Valid values aretrue(enable integration) andfalse(disable integration). The default istrue.config-client.retry.max-attempts: Sets the maximum number of attempts that should be made to connect to the configuration microservice. The default is 20. The Self-Service Analytics microservice will fail if the number of attempts to connect to the configuration microservice exceeds this value. This property is useful in situations where the configuration microservice starts with a delay. If your microservice fails while waiting for the configuration microservice and you want to give it more time, increase this value.
-
Install, enable and start the configuration microservice. Enter the following commands:
After starting the configuration microservice with a valid database configuration, the microservice should connect to the database and create a properties table.
-
Restart all the other microservices. Enter the following command:
See also Restart Microservices.
Set Up the Configuration Microservice Metadata Store or Repository
Before you can install and start Self-Service Analytics’s configuration microservice, you must set up a PostgreSQL metastore or a GitHub repository to store Self-Service Analytics property metadata. A separate PostgreSQL database or a separate GitHub repository must be configured.PostgreSQL Database Setup Notes
If you elect to persist property metadata to a PostgreSQL metastore:-
Configure a separate database and make it accessible to the connection user account:
where
<composer-config>is the name of the PostgreSQL database and<db_username>is the connection user account name. -
Add the following properties to the Self-Service Analytics
config-server.propertiesfile, located in the/etc/zoomdatadirectory:Substitute the connection user account name and password you set up in Step 1 for<db_username>and<db_password>. Substitute the name of the PostgreSQL database for<composer-config>. - Save the properties file. You will restart the configuration microservice when you configure it. See Configure and Start the Configuration Microservice.
GitHub Repository Setup Notes
If you elect to persist property metadata to a GitHub repository:-
Add the following properties to the Self-Service Analytics
config-server.propertiesfile, located in the/etc/zoomdatadirectory:Substitute the repository user account name and password for<repo_username>and<repo_password>. Substitute the URI of the repository for<repo_uri>(for example,https://example.com/my/repo). Additional and advanced configuration information can be found in Spring.io’s documentation. - Save the properties file. You will restart the configuration microservice when you configure it. See Configure and Start the Configuration Microservice.
Self-Service Analytics Monitoring Solution
Self-Service Analytics system metrics are published by all microservices. While these measurements provide some visibility of the operating state of the services, the metric data becomes more useful once it can be stored and viewed. In order to provide Self-Service Analytics deployments with observability into the health and performance of the running system, you can use a monitoring solution. This topic describes an example monitoring solution that we make available for download with each release of Self-Service Analytics.Monitoring Solution Components
The monitoring solution consists of several components that are built up as layers.- Generic operating and Self-Service Analytics specific metrics form the fixed foundation layer and are published in various formats.
- Subsequent layers provide storage and visualization capabilities to support further analysis.
Subsequent components added to the metrics foundation can be implemented as provided in the monitoring solution package, or you can substitute them with preferred components that were already deployed.
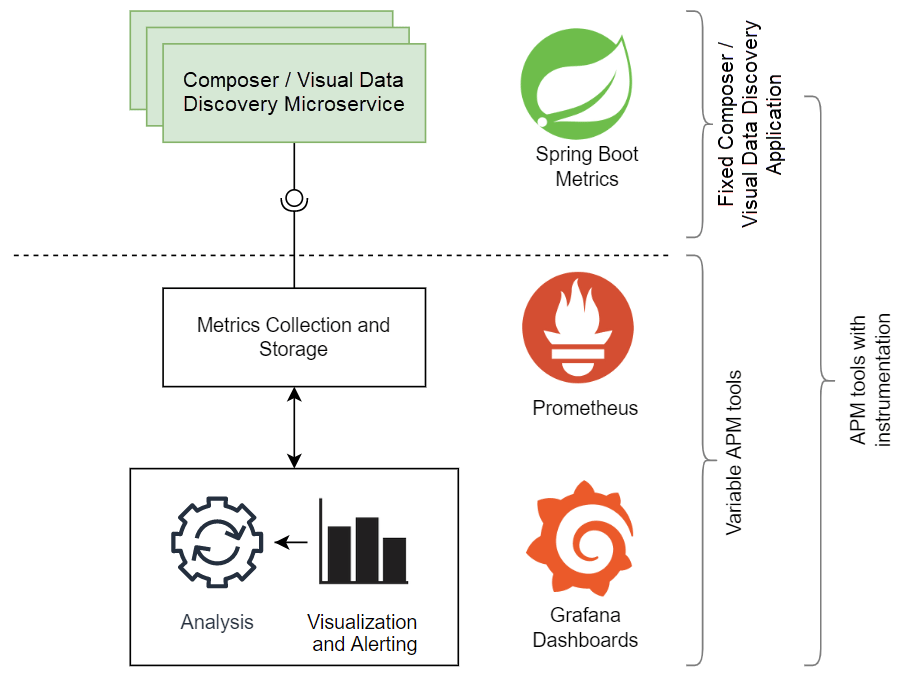
- Prometheus service collects and stores metrics in a time series database.
- Grafana supports further analysis by providing visualization of stored metrics on pre-built application-specific dashboards.
Downloading and Installing the Solution Package
- Contact your Customer Support representative to download the Solution Package: Customer Support.
-
When you get the tarball, extract the tarball to the directory you create.
- Open the READ.me file and follow the directions included.