
- Enable Microservices
- Start Microservices
- Restart Microservices
- Stop Microservices
- Disable Microservices
- Microservice Startup Order
Enable Microservices
You can also enable microservices using the CLI. See Manage Self-Service Analytics Microservices Using the Command Line Utility. To enable all microservices, enter the following command:<service> with the name of the microservice. See Self-Service Analytics Microservice Name Reference.
Start Microservices
The list of microservices can be found in Self-Service Analytics Microservice Name Reference. The order in which microservices should be started is described in Microservice Startup Order. You can also start microservices using the CLI. See Manage Self-Service Analytics Microservices Using the Command Line Utility. To start all microservices, enter the following command:<service> with the name of the microservice. See Self-Service Analytics Microservice Name Reference.
Restart Microservices
You can also restart microservices using the CLI. See Manage Self-Service Analytics Microservices Using the Command Line Utility. To restart all microservices, enter the following command:<service> with the name of the microservice. See Self-Service Analytics Microservice Name Reference.
Stop Microservices
You can also stop microservices using the CLI. See Manage Self-Service Analytics Microservices Using the Command Line Utility. To stop all microservices, enter the following command:<service> with the name of the microservice. See Self-Service Analytics Microservice Name Reference.
Disable Microservices
You can also disable microservices using the CLI. See Manage Self-Service Analytics Microservices Using the Command Line Utility. To disable all microservices, enter the following command:<service> with the name of the microservice. See Self-Service Analytics Microservice Name Reference.
Microservice Startup Order
The only microservices that must be started first are the Postgres and Service Discovery microservices. The other microservices are more tolerant and can be started in any order. insightsoftware recommends starting microservices in the following order. You can start microservices using CentOS or Ubuntu commands or using the CLI. See Start Microservices and Manage Self-Service Analytics Microservices Using the Command Line Utility. A full list of Self-Service Analytics microservices can be found in Self-Service Analytics Microservice Name Reference.-
The Postgres microservice (
postgresql-<version>) used for metadata storage (where<version>is the version of Postgres you have installed. -
The Service Discovery microservice (
zoomdata-consul) used for microservice discovery. -
The connector microservices (in the format
zoomdata-edc-<connector_name>) used to connect to different data stores. The following CentOS example starts all available connector microservices, rather than starting them individually: -
The query engine microservice (
zoomdata-query-engine) used for query engine processing. -
The
zoomdata-data-writer-postgresqlmicroservice. -
The following optional microservices, if they are installed.
zoomdata-admin-serverzoomdata-screenshot-service
-
The main Self-Service Analytics microservice (
zoomdata).
Scaling Self-Service Analytics Microservices
Self-Service Analytics microservices allow you to scale your Self-Service Analytics installation, giving you expanded performance gains. As you roll out your microservices changes, you will need to:- Estimate User and Microservice Loads
- Add or Remove Nodes in a High Availability Environment
- Configure Throughput for Microservices
- Load Monitor Microservices
- Scale Microservices Up
- Scale Microservices Down
Estimate User and Microservice Loads
The load used by each microservice depends on the type of interactions your users have while using Self-Service Analytics. Some actions load only the composer web component, while others may load multiple components. Some examples of actions that load microservices are included in the table below.Horizontal scaling up of a microservice does not provide doubled performance gains due to sharing of PostreSQL resources and overlapping of microservices.
Add or Remove Nodes in a High Availability Environment
To scale a microservice up or down, you may need to Add Nodes to an Existing High Availability Installation or Remove Nodes from a High Availability Environment. Before you add or remove nodes, you should understand the actual load on your microservices to make the decision of scaling up or down. See Self-Service Analytics System Metrics.Configure Throughput for Microservices
All microservices have a configuration property,server.jetty.max-threads, you can use to limit throughput. Once configured, you can more accurately monitor the load on each microservice.
Set your estimated concurrent users for each service at +20%, based on your calculations made using Server Size Guidelines. To manage configuration properties of server.jetty.max-threads, see Configure and Start the Configuration Microservice.
For example, if you have three instances of the query engine microservice and you expect 150 concurrent users, each instance is expected to handle 50 concurrent users. To accommodate this demand, set server.jetty.max-threads to (60 = 150 / 3 & 120%) for each instance of query engine.
Load Monitor Microservices
With throughput defined for your microservices, you can measure their use to decide what services to scale up or scale down. Self-Service Analytics microservices exposes several different metrics to help you understand the current load on each service. The main outputs to monitor include:jetty_threads_busyshows a current count of concurrent users.jetty_threads_config_maxshows the maximum allowed concurrent users. This should match the value you set inserver.jetty.max-threads.
Scale Microservices Up
The recommended load threshold for all microservices is 90%. After setting up your thresholds, monitor them manually, or use a metric monitoring tool such as Prometheus to define alerts at that threshold.Scale Microservices Down
When monitoring microservices for scaling up, you define and set alerts around defined load thresholds for types of services. In contrast, when you monitor services to scale them down, monitor free resources, the amount of free threads dedicated to the system. The recommended threshold is dedicate two times the resources of a single instance(2 * resources).
Average over five minutes:
Self-Service Analytics System Metrics
Self-Service Analytics exposes metrics for discovering and monitoring Self-Service Analytics microservices. Discover system metrics using one of several available tools.Discovering Metrics
Connect to the composer-webservice actuator endpoints at:http://[host_ip]:[port]/composer/actuator.
Available endpoints include:
http://[host_ip]:[port]/actuator.
Available endpoints include:
http://[host_ip]:[port]/actuator/metrics.
Monitoring Microservices: Prometheus
Self-Service Analytics metrics data is formatted so you can access that data through a Prometheus server. Navigate to the Prometheus composer-web actuator endpoint to see your data:http://[host_ip]:[port]/composer/actuator/prometheus.
Example Prometheus actuator response:
Configure Prometheus
Install Prometheus. See https://prometheus.io/docs/prometheus/latest/getting_started/ for more information. Build yourprometheus.yml as shown in the example here to connect to the composer-webservice. Replace [username], [password] , [host_ip] and [port] with your appropriate values.
Monitoring Microservices: Statsd and Graphite
You can also collect Self-Service Analytics metrics using the network daemon statsd. This network daemon runs on the Node.js platform to listen for statistics sent over UDP or TCP and sends aggregate information to one or more backend services. Unlike Prometheus, statsd does not collect metric data from specific endpoints. Use in conjunction with Graphite to store numeric time-series data and render data graphs on demand.Setup and Configure Statsd and Graphite
Install statsd and Graphite to connect to and access system metrics. Example of a Graphite dashboard with metrics collected by statsd: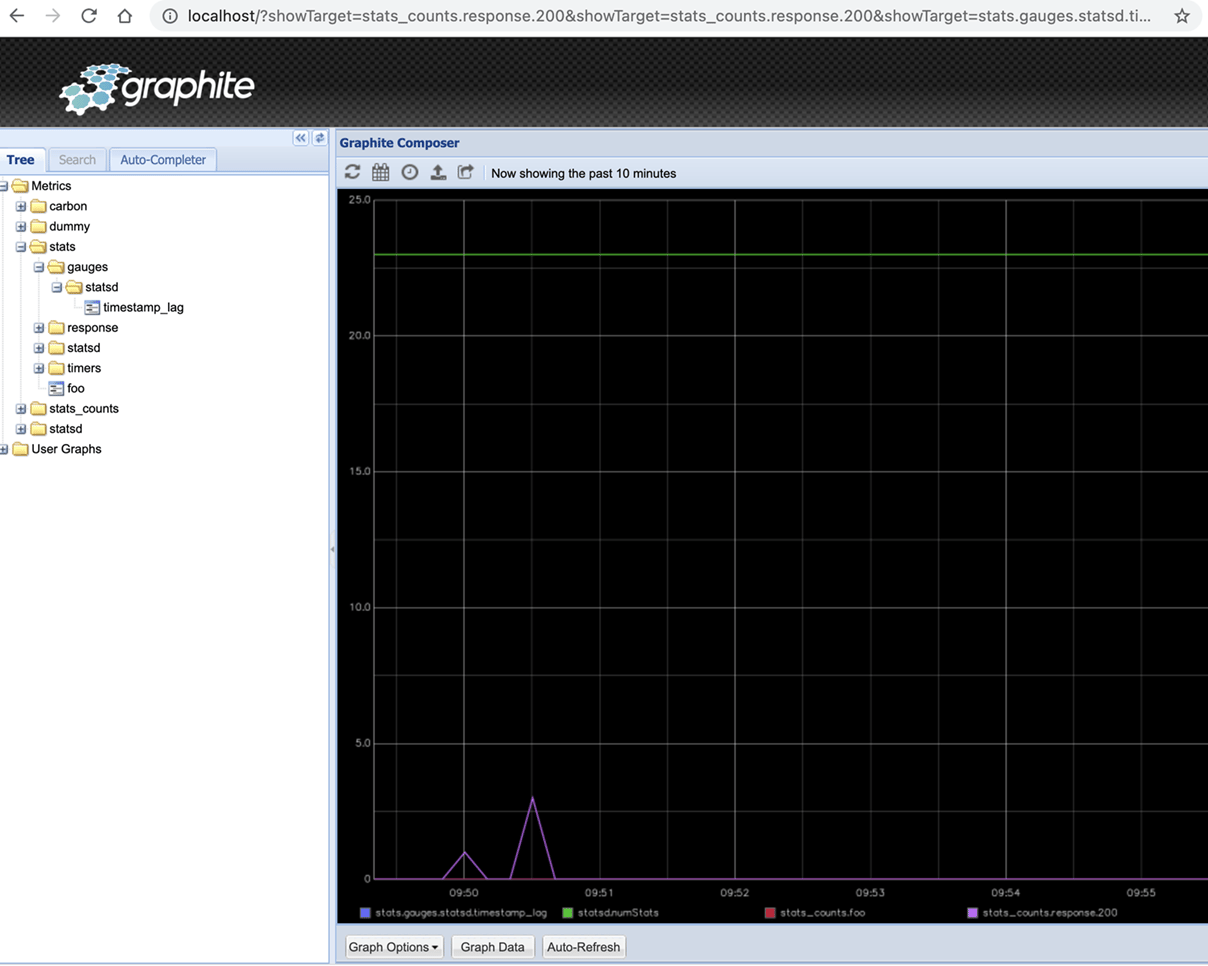
Manage Self-Service Analytics Microservices Using the Command Line Utility
You can use thezdmanage CLI command to manage the various microservices that are deployed in the Self-Service Analytics environment. This command line utility is automatically installed when installing your software using the automated installation script. This utility script wraps underlying UNIX commands to help you perform common management operations such as stopping and starting microservices.
Prerequisites
To use the command line utility tool, you need root access.Using the Command Line Utility Tool
Thezdmanage command line utility is located in the following directory:
zdmanage CLI command syntax is as follows:
<command>) are supported:
| Command | Action |
|---|---|
list | Displays all the microservices installed in your deployment. |
status | Provides a status of all microservices in your Self-Service Analytics environment. |
start | Starts microservices. The order in which microservices should be restarted is described in Microservice Startup Order. |
stop | Stops microservices. |
restart | Restarts microservices. |
enable | Enables microservices automatically when the OS starts up. |
disable | Shuts down microservices automatically when the OS starts up. |
configure | Opens the specified Self-Service Analytics property file. |
<service_name>, specify the microservice name or all (to apply the command to all Self-Service Analytics microservices). For a complete list of microservices, see Self-Service Analytics Microservice Name Reference.
Common Commands
Show all Self-Service Analytics microservices installed:Manage the Self-Service Analytics Query Engine
The query engine is a stand-alone microservice within your Self-Service Analytics environment that processes visual queries. If you install or upgrade Self-Service Analytics using the supplied installation script, the query engine microservice is started automatically. If you install or upgrade Self-Service Analytics manually, you must manually enable and start the query engine microservice.Configure the Query Engine
In your environment, the query engine is calledzoomdata-query-engine. To configure and manage the microservices that the query engine executes and runs, you need to make changes to the query-engine.properties file. It contains properties that are specific to how the query engine operates within your environment.
The query engine also has a query-engine.env file and a query-engine.jvm file. You can edit these files to configure the following:
- To define the environment variables that are visible for the microservice, edit the
query-engine.envfile. - To configure the JVM options that are used to start up Self-Service Analytics microservices, edit the
query-engine.jvmfile.