> ## Documentation Index
> Fetch the complete documentation index at: https://insightsoftware.mintlify.site/llms.txt
> Use this file to discover all available pages before exploring further.
# Embeddable Component Snippets
> Describes the prerequisites that must be met before you can embed a dashboard into your own application.
## Generate an Embeddable Dashboard HTML Snippet
You can generate an embeddable HTML snippet for a dashboard using the UI.
For even more control, use JavaScript to embed the dashboard. See [Embed Components Using JavaScript and Trusted Access](/simba-embedded-analytics/docs/self-service-analytics/26.3/embed-and-extend/embed/embed-javascript).
In this release, when your admin enables the Enhanced Experience user interface, you will see changes to workflows you may have used in previous releases.
**Generate an embeddable HTML snippet for a dashboard**
1. Log into the UI as an administrator or as a user assigned to a group with the **Generate Embed Code** [privilege](/simba-embedded-analytics/docs/self-service-analytics/26.3/administer/users/aaa-ov#group-privilege-reference).
2. Select the **Discovery Board** card on your home page or **Library** from the main menu. The dashboard library opens.
3. Locate the dashboard in the library list for which you want to generate an embeddable snippet.
4. Select  in the associated **Actions** column. The Embed Code dialog appears.
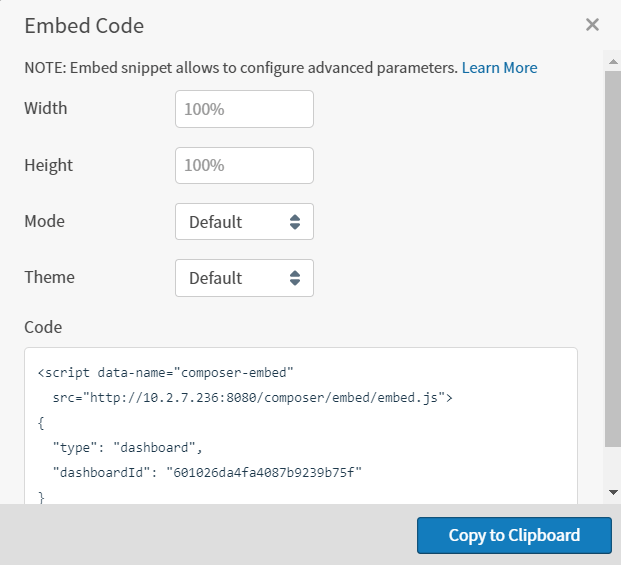 The **Code** section of this dialog shows the embeddable snippet. If you do not need to change any of the default settings on this page, simply select **Copy to Clipboard** and you can skip the rest of these steps and embed the copied snippet in your application.
If, however, you want to alter the default settings on this dialog, continue with the rest of these steps. Note as you change settings that the embeddable snippet is updated automatically. All settings are optional.
5. The default width setting (100%) is shown in the **Width** box. Click in the box and enter the width value you want in CSS units. For example, `800px`, `75%`, `500em` and `80vw` are all valid settings.
6. The default height setting (100%) is shown in the **Height** box. Click in the box and enter the height value you want in CSS units. For example, `800px`, `75%`, `500em` and `80vh` are all valid settings.
7. Select a mode in the **Mode** box. The mode setting determines the way in which your users will be able to work with the embedded dashboard. If you do not want the user in your application to change anything and only be able to view the dashboard, select **Read Only**. If you want your users to be able to make changes to the dashboard, select **Interactive**. The default is **Interactive**.
When the mode is **Read Only**, the dashboard cannot be changed.
The level of interactivity a user has with an embedded dashboard is determined by the interactivity settings of each visual in the dashboard. See [Control How Users Interact With a Visual](/simba-embedded-analytics/docs/self-service-analytics/26.3/analyze-data/visuals/visual-interactivity).
8. Select a theme in the **Theme** box. You can select any available themes. See [Supplied Themes](/simba-embedded-analytics/docs/self-service-analytics/26.3/embed-and-extend/themes/themes-ov#user-interface-themes-v26-3-and-later-supplied-themes).
If you add your own themes to the application, more options are available in this list. For information on adding your own UI themes, see [Manage User Interface Themes](/simba-embedded-analytics/docs/self-service-analytics/26.3/embed-and-extend/themes/themes-ov).
9. When all the optional settings are specified as you need, select **Copy to Clipboard** to copy the embeddable dashboard snippet to the clipboard. You can then paste the embeddable HTML snippet into your application code.
10. Close the Embed Code dialog by selecting the **x** in the upper right corner of the dialog.
11. If you want to specify additional properties for your embedded dashboard, use Javascript. The supported dashboard properties are described in [Embedded Dashboard Properties and Objects](/simba-embedded-analytics/docs/self-service-analytics/26.3/embed-and-extend/embed/embed-javascript-embedmanager-methods#embedded-dashboard-properties-and-objects).
## Generate an Embeddable Report HTML Snippet
You can generate an embeddable HTML snippet for a report using the UI.
To use self service reports, you will need to enable it in your environment. See [Server-Level Variables](/simba-embedded-analytics/docs/self-service-analytics/26.3/administer/configure/config-mgmt-ov#server-level-variables).
For even more control, use JavaScript to embed the report. See [Embed Components Using JavaScript and Trusted Access](/simba-embedded-analytics/docs/self-service-analytics/26.3/embed-and-extend/embed/embed-javascript).
In this release, when your admin enables the Enhanced Experience user interface, you will see changes to workflows you may have used in previous releases.
**Generate an embeddable HTML snippet for a report**
1. Log into the UI as an administrator or as a user assigned to a group with the **Generate Embed Code** [privilege](/simba-embedded-analytics/docs/self-service-analytics/26.3/administer/users/aaa-ov#group-privilege-reference).
2. Select the **Reports** card on your home page or **Library** from the main menu. The library opens; select the Reports tab if needed.
3. Locate the report for which you want to generate an embeddable snippet.
4. Select in the associated **Actions** column. The Embed Code dialog appears.
The **Code** section of this dialog shows the embeddable snippet. If you do not need to change any of the default settings on this page, simply select **Copy to Clipboard** and you can skip the rest of these steps and embed the copied snippet in your application.
If, however, you want to alter the default settings on this dialog, continue with the rest of these steps. Note as you change settings that the embeddable snippet is updated automatically. All settings are optional.
5. The default width setting (100%) is shown in the **Width** box. Click in the box and enter the width value you want in CSS units. For example, `800px`, `75%`, `500em` and `80vw` are all valid settings.
6. The default height setting (100%) is shown in the **Height** box. Click in the box and enter the height value you want in CSS units. For example, `800px`, `75%`, `500em` and `80vh` are all valid settings.
7. Select a mode in the **Mode** box. The mode setting determines the way in which your users will be able to work with the embedded report. If you do not want the user in your application to change anything and only be able to view the report, select **Read Only**. If you want your users to be able to make changes to the report, select **Interactive**. The default is **Interactive**.
When the mode is **Read Only**, the report cannot be changed.
The level of interactivity a user has with an embedded report is determined by the interactivity settings of each visual in the report. See [Control How Users Interact With a Visual](/simba-embedded-analytics/docs/self-service-analytics/26.3/analyze-data/visuals/visual-interactivity).
8. Select a theme in the **Theme** box. You can select any available themes. See [Supplied Themes](/simba-embedded-analytics/docs/self-service-analytics/26.3/embed-and-extend/themes/themes-ov#user-interface-themes-v26-3-and-later-supplied-themes).
If you add your own themes to the application, more options are available in this list. For information on adding your own UI themes, see [Manage User Interface Themes](/simba-embedded-analytics/docs/self-service-analytics/26.3/embed-and-extend/themes/themes-ov).
9. When all the optional settings are specified as you need, select **Copy to Clipboard** to copy the embeddable report snippet to the clipboard. You can then paste the embeddable HTML snippet into your application code.
10. Close the Embed Code dialog by selecting the **x** in the upper right corner of the dialog.
11. If you want to specify additional properties for your embedded report, use Javascript. The supported dashboard properties are described in [Embedded Dashboard Properties and Objects](/simba-embedded-analytics/docs/self-service-analytics/26.3/embed-and-extend/embed/embed-javascript-embedmanager-methods#embedded-dashboard-properties-and-objects).
The **Code** section of this dialog shows the embeddable snippet. If you do not need to change any of the default settings on this page, simply select **Copy to Clipboard** and you can skip the rest of these steps and embed the copied snippet in your application.
If, however, you want to alter the default settings on this dialog, continue with the rest of these steps. Note as you change settings that the embeddable snippet is updated automatically. All settings are optional.
5. The default width setting (100%) is shown in the **Width** box. Click in the box and enter the width value you want in CSS units. For example, `800px`, `75%`, `500em` and `80vw` are all valid settings.
6. The default height setting (100%) is shown in the **Height** box. Click in the box and enter the height value you want in CSS units. For example, `800px`, `75%`, `500em` and `80vh` are all valid settings.
7. Select a mode in the **Mode** box. The mode setting determines the way in which your users will be able to work with the embedded dashboard. If you do not want the user in your application to change anything and only be able to view the dashboard, select **Read Only**. If you want your users to be able to make changes to the dashboard, select **Interactive**. The default is **Interactive**.
When the mode is **Read Only**, the dashboard cannot be changed.
The level of interactivity a user has with an embedded dashboard is determined by the interactivity settings of each visual in the dashboard. See [Control How Users Interact With a Visual](/simba-embedded-analytics/docs/self-service-analytics/26.3/analyze-data/visuals/visual-interactivity).
8. Select a theme in the **Theme** box. You can select any available themes. See [Supplied Themes](/simba-embedded-analytics/docs/self-service-analytics/26.3/embed-and-extend/themes/themes-ov#user-interface-themes-v26-3-and-later-supplied-themes).
If you add your own themes to the application, more options are available in this list. For information on adding your own UI themes, see [Manage User Interface Themes](/simba-embedded-analytics/docs/self-service-analytics/26.3/embed-and-extend/themes/themes-ov).
9. When all the optional settings are specified as you need, select **Copy to Clipboard** to copy the embeddable dashboard snippet to the clipboard. You can then paste the embeddable HTML snippet into your application code.
10. Close the Embed Code dialog by selecting the **x** in the upper right corner of the dialog.
11. If you want to specify additional properties for your embedded dashboard, use Javascript. The supported dashboard properties are described in [Embedded Dashboard Properties and Objects](/simba-embedded-analytics/docs/self-service-analytics/26.3/embed-and-extend/embed/embed-javascript-embedmanager-methods#embedded-dashboard-properties-and-objects).
## Generate an Embeddable Report HTML Snippet
You can generate an embeddable HTML snippet for a report using the UI.
To use self service reports, you will need to enable it in your environment. See [Server-Level Variables](/simba-embedded-analytics/docs/self-service-analytics/26.3/administer/configure/config-mgmt-ov#server-level-variables).
For even more control, use JavaScript to embed the report. See [Embed Components Using JavaScript and Trusted Access](/simba-embedded-analytics/docs/self-service-analytics/26.3/embed-and-extend/embed/embed-javascript).
In this release, when your admin enables the Enhanced Experience user interface, you will see changes to workflows you may have used in previous releases.
**Generate an embeddable HTML snippet for a report**
1. Log into the UI as an administrator or as a user assigned to a group with the **Generate Embed Code** [privilege](/simba-embedded-analytics/docs/self-service-analytics/26.3/administer/users/aaa-ov#group-privilege-reference).
2. Select the **Reports** card on your home page or **Library** from the main menu. The library opens; select the Reports tab if needed.
3. Locate the report for which you want to generate an embeddable snippet.
4. Select in the associated **Actions** column. The Embed Code dialog appears.
The **Code** section of this dialog shows the embeddable snippet. If you do not need to change any of the default settings on this page, simply select **Copy to Clipboard** and you can skip the rest of these steps and embed the copied snippet in your application.
If, however, you want to alter the default settings on this dialog, continue with the rest of these steps. Note as you change settings that the embeddable snippet is updated automatically. All settings are optional.
5. The default width setting (100%) is shown in the **Width** box. Click in the box and enter the width value you want in CSS units. For example, `800px`, `75%`, `500em` and `80vw` are all valid settings.
6. The default height setting (100%) is shown in the **Height** box. Click in the box and enter the height value you want in CSS units. For example, `800px`, `75%`, `500em` and `80vh` are all valid settings.
7. Select a mode in the **Mode** box. The mode setting determines the way in which your users will be able to work with the embedded report. If you do not want the user in your application to change anything and only be able to view the report, select **Read Only**. If you want your users to be able to make changes to the report, select **Interactive**. The default is **Interactive**.
When the mode is **Read Only**, the report cannot be changed.
The level of interactivity a user has with an embedded report is determined by the interactivity settings of each visual in the report. See [Control How Users Interact With a Visual](/simba-embedded-analytics/docs/self-service-analytics/26.3/analyze-data/visuals/visual-interactivity).
8. Select a theme in the **Theme** box. You can select any available themes. See [Supplied Themes](/simba-embedded-analytics/docs/self-service-analytics/26.3/embed-and-extend/themes/themes-ov#user-interface-themes-v26-3-and-later-supplied-themes).
If you add your own themes to the application, more options are available in this list. For information on adding your own UI themes, see [Manage User Interface Themes](/simba-embedded-analytics/docs/self-service-analytics/26.3/embed-and-extend/themes/themes-ov).
9. When all the optional settings are specified as you need, select **Copy to Clipboard** to copy the embeddable report snippet to the clipboard. You can then paste the embeddable HTML snippet into your application code.
10. Close the Embed Code dialog by selecting the **x** in the upper right corner of the dialog.
11. If you want to specify additional properties for your embedded report, use Javascript. The supported dashboard properties are described in [Embedded Dashboard Properties and Objects](/simba-embedded-analytics/docs/self-service-analytics/26.3/embed-and-extend/embed/embed-javascript-embedmanager-methods#embedded-dashboard-properties-and-objects).
Generate a Sources Inventory HTML Snippet
You can generate an embeddable HTML snippet for the sources inventory using the UI.
**Generate an embeddable HTML snippet**
1. Log into the UI as an administrator or as a user assigned to a group with the **Generate Embed Code** [privilege](/simba-embedded-analytics/docs/self-service-analytics/26.3/administer/users/aaa-ov#group-privilege-reference).
2. Select the **Source** card on your home page or **Data Sources** from the main menu. The [Sources page](/simba-embedded-analytics/docs/self-service-analytics/26.3/connect-to-data/sources/data-source-config-overview#data-sources-page) appears.
3. Select the embed sources inventory icon () above the list of sources. The Embed Code dialog appears.
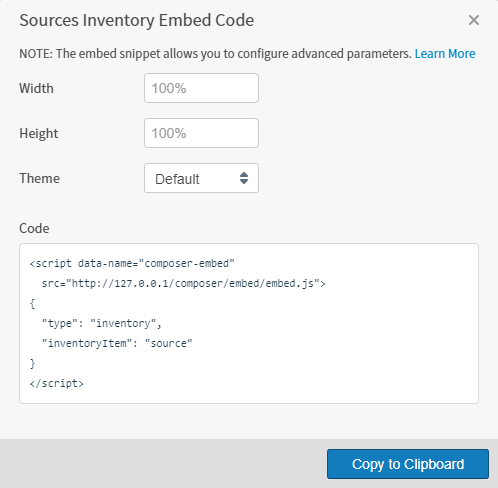 The Code section of this dialog shows the embeddable snippet. If you do not need to change any of the default settings on this page, simply select **Copy to Clipboard** and you can skip the rest of these steps and embed the copied snippet in your application.
If, however, you want to alter the default settings on this dialog, continue with the rest of these steps. Note as you change settings that the embeddable snippet is updated automatically. All settings are optional.
4. The default width setting (100%) is shown in the **Width** box. Select the entry field, then enter the width value you want in CSS units. For example, `800px`, `75%`, `500em` and `80vw` are all valid settings.
5. The default height setting (100%) is shown in the **Height** box. Select the entry field, then enter the height value you want in CSS units. For example, `800px`, `75%`, `500em` and `80vh` are all valid settings.
6. Select a theme in the **Theme** box. By default, three possible themes are available: **Logi-Composer**, **Logi-Modern**, and **Logi-Dark**. However, if you add your own themes to the application, more options are available in this list. The default is **Logi-Composer**, which is the same as the **Logi-Modern** theme. For information on adding your own UI themes, see [Manage User Interface Themes](/simba-embedded-analytics/docs/self-service-analytics/26.3/embed-and-extend/themes/themes-ov).
7. When all the optional settings are defined as you need, select **Copy to Clipboard** to copy the HTML snippet to the clipboard. You can then paste the this snippet into your application code.
8. Close the Embed Code dialog by selecting the **x** in the upper right corner of the dialog.
The Code section of this dialog shows the embeddable snippet. If you do not need to change any of the default settings on this page, simply select **Copy to Clipboard** and you can skip the rest of these steps and embed the copied snippet in your application.
If, however, you want to alter the default settings on this dialog, continue with the rest of these steps. Note as you change settings that the embeddable snippet is updated automatically. All settings are optional.
4. The default width setting (100%) is shown in the **Width** box. Select the entry field, then enter the width value you want in CSS units. For example, `800px`, `75%`, `500em` and `80vw` are all valid settings.
5. The default height setting (100%) is shown in the **Height** box. Select the entry field, then enter the height value you want in CSS units. For example, `800px`, `75%`, `500em` and `80vh` are all valid settings.
6. Select a theme in the **Theme** box. By default, three possible themes are available: **Logi-Composer**, **Logi-Modern**, and **Logi-Dark**. However, if you add your own themes to the application, more options are available in this list. The default is **Logi-Composer**, which is the same as the **Logi-Modern** theme. For information on adding your own UI themes, see [Manage User Interface Themes](/simba-embedded-analytics/docs/self-service-analytics/26.3/embed-and-extend/themes/themes-ov).
7. When all the optional settings are defined as you need, select **Copy to Clipboard** to copy the HTML snippet to the clipboard. You can then paste the this snippet into your application code.
8. Close the Embed Code dialog by selecting the **x** in the upper right corner of the dialog.
Generate a Visual Gallery HTML Snippet
You can generate an embeddable HTML snippet for the visual gallery using the UI.
**Generate an embeddable HTML snippet**
1. Log into the UI as an administrator or as a user assigned to a group with the **Generate Embed Code** [privilege](/simba-embedded-analytics/docs/self-service-analytics/26.3/administer/users/aaa-ov#group-privilege-reference).
2. Select **Visual Gallery** from the main menu. The [visual gallery](/simba-embedded-analytics/docs/self-service-analytics/26.3/analyze-data/visuals/visual-gallery) appears.
3. Select the embed library icon () above the list of visuals. The Embed Code dialog appears.
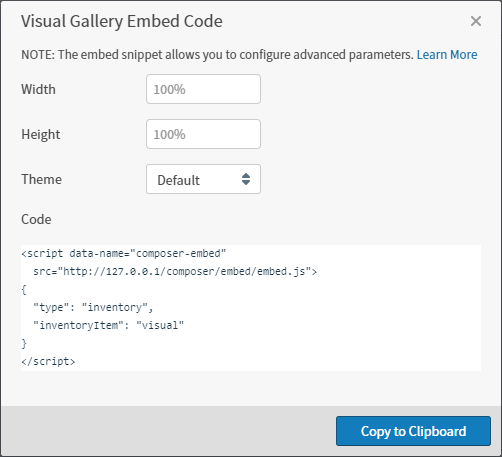 The Code section of this dialog shows the embeddable snippet. If you do not need to change any of the default settings on this page, simply select **Copy to Clipboard** and you can skip the rest of these steps and embed the copied snippet in your application.
If, however, you want to alter the default settings on this dialog, continue with the rest of these steps. Note as you change settings that the embeddable snippet is updated automatically. All settings are optional.
4. The default width setting (100%) is shown in the **Width** box. Select the entry field, then enter the width value you want in CSS units. For example, `800px`, `75%`, `500em` and `80vw` are all valid settings.
5. The default height setting (100%) is shown in the **Height** box. Select the entry field, then enter the height value you want in CSS units. For example, `800px`, `75%`, `500em` and `80vh` are all valid settings.
6. Select a theme in the **Theme** box. By default, three possible themes are available: **Logi-Composer**, **Logi-Modern**, and **Logi-Dark**. However, if you add your own themes to the application, more options are available in this list. The default is **Logi-Composer**, which is the same as the **Logi-Modern** theme. For information on adding your own UI themes, see [Manage User Interface Themes](/simba-embedded-analytics/docs/self-service-analytics/26.3/embed-and-extend/themes/themes-ov).
7. When all the optional settings are defined as you need, select **Copy to Clipboard** to copy the HTML snippet to the clipboard. You can then paste the this snippet into your application code.
8. Close the Embed Code dialog by selecting the **x** in the upper right corner of the dialog.
The Code section of this dialog shows the embeddable snippet. If you do not need to change any of the default settings on this page, simply select **Copy to Clipboard** and you can skip the rest of these steps and embed the copied snippet in your application.
If, however, you want to alter the default settings on this dialog, continue with the rest of these steps. Note as you change settings that the embeddable snippet is updated automatically. All settings are optional.
4. The default width setting (100%) is shown in the **Width** box. Select the entry field, then enter the width value you want in CSS units. For example, `800px`, `75%`, `500em` and `80vw` are all valid settings.
5. The default height setting (100%) is shown in the **Height** box. Select the entry field, then enter the height value you want in CSS units. For example, `800px`, `75%`, `500em` and `80vh` are all valid settings.
6. Select a theme in the **Theme** box. By default, three possible themes are available: **Logi-Composer**, **Logi-Modern**, and **Logi-Dark**. However, if you add your own themes to the application, more options are available in this list. The default is **Logi-Composer**, which is the same as the **Logi-Modern** theme. For information on adding your own UI themes, see [Manage User Interface Themes](/simba-embedded-analytics/docs/self-service-analytics/26.3/embed-and-extend/themes/themes-ov).
7. When all the optional settings are defined as you need, select **Copy to Clipboard** to copy the HTML snippet to the clipboard. You can then paste the this snippet into your application code.
8. Close the Embed Code dialog by selecting the **x** in the upper right corner of the dialog.