> ## Documentation Index
> Fetch the complete documentation index at: https://insightsoftware.mintlify.site/llms.txt
> Use this file to discover all available pages before exploring further.
# Part 2: Query Variables, Chart Defaults, Data Preview, and Data Accessors
> Part 2 of the custom chart tutorial shows you how to use query variables, chart defaults, data preview, and data accessors with a custom chart.
This part of the custom chart tutorial introduces query variables, chart defaults, data preview, and data accessors. The following steps are performed in Part 2:
* [Step 1. Modify Query Variables](#step-1-modify-query-variables)
* [Step 2. Preview the Data](#step-2-preview-the-data)
* [Step 3. Use Data Accessors](#step-3-use-data-accessors)
Step 1. Modify Query Variables
Self-Service Analytics’s front-end client communicates with the back-end data repositories using a WebSocket API designed to translate query messages into the appropriate native query language. To generate query messages, a custom chart must define the data variables that specify the query type and required fields.
**Follow these steps**:
1. Using the chart you created in [Part 1: Custom Chart Basics](/simba-embedded-analytics/docs/self-service-analytics/26.3/embed-and-extend/custom-charts/custom-chart-tut-ov#part-1-custom-chart-basics), find the list of query variables created with the default Single-Group chart template.
2. Enter the following command in the terminal window from the chart’s root directory window:
```
cmp-chart edit
```
3. Use arrow keys to follow the prompts and press **Enter** to select the following options, in this sequence:
1. `Variables`
2. `List variables`
The output of the terminal window should look like the following image:
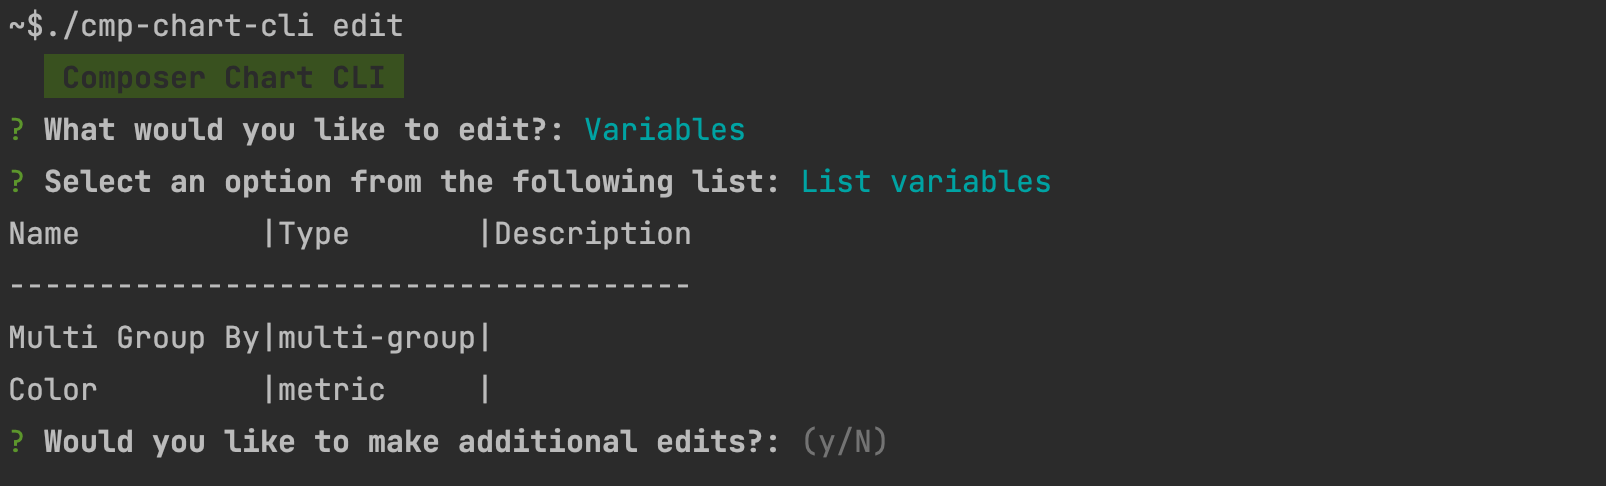 Notice the group and metric variable list in the table. A group variable indicates that the chart generates a request for grouped, or aggregated, data in the query. In this case, the chart defines a single group by field. A metric variable indicates that the chart will perform an aggregation function on a numeric field as part of the grouped data query. In this chart, a single metric is specified. The chart’s default configuration defines the actual group-by and metric fields at the source level.
4. Enter **Y** for the "Would you like to make additional edits?" prompt.
5. Select the following options, in this sequence:
1. `Variables`
2. `Edit a variable`
3. `Metric |metric|`
6. For the remaining prompts, enter the following information:
1. What would you like to edit: **Name**
2. Please enter a new name for the variable: **Size**
7. Enter **N** when prompted to make additional edits.
If you are still running in watch mode in the terminal window, (see [Part 1: Custom Chart Basics](/simba-embedded-analytics/docs/self-service-analytics/26.3/embed-and-extend/custom-charts/custom-chart-tut-ov#part-1-custom-chart-basics)), the variable change will be automatically pushed to the server. If it is not, run the following command to ensure the change is pushed to the server.
```
cmp-chart push
```
You have now defined a group query variable named **Group By** and a metric query variable named **Size** in the chart.
Notice the group and metric variable list in the table. A group variable indicates that the chart generates a request for grouped, or aggregated, data in the query. In this case, the chart defines a single group by field. A metric variable indicates that the chart will perform an aggregation function on a numeric field as part of the grouped data query. In this chart, a single metric is specified. The chart’s default configuration defines the actual group-by and metric fields at the source level.
4. Enter **Y** for the "Would you like to make additional edits?" prompt.
5. Select the following options, in this sequence:
1. `Variables`
2. `Edit a variable`
3. `Metric |metric|`
6. For the remaining prompts, enter the following information:
1. What would you like to edit: **Name**
2. Please enter a new name for the variable: **Size**
7. Enter **N** when prompted to make additional edits.
If you are still running in watch mode in the terminal window, (see [Part 1: Custom Chart Basics](/simba-embedded-analytics/docs/self-service-analytics/26.3/embed-and-extend/custom-charts/custom-chart-tut-ov#part-1-custom-chart-basics)), the variable change will be automatically pushed to the server. If it is not, run the following command to ensure the change is pushed to the server.
```
cmp-chart push
```
You have now defined a group query variable named **Group By** and a metric query variable named **Size** in the chart.
Step 2. Preview the Data
**Preview the data retrieved for your custom chart**
1. In the terminal window, change directories to the local directory of “My First Custom Chart” and enter the following command to set the custom chart CLI in watch mode, if it is not in watch mode already.
```
cmp-chart watch
```
2. In another terminal window, run the following command to compile a development version of the chart’s code using the webpack bundler:
```bash theme={null}
npm start
```
For a refresher on this topic, see [Step 4. Edit the Chart Code](/simba-embedded-analytics/docs/self-service-analytics/26.3/embed-and-extend/custom-charts/custom-chart-tut-ov#step-4-edit-the-chart-code).
3. Edit the `src/index.js` file in your preferred text editor or integrated development environment.
4. Modify the code of the `controller.update` function as follows to output the data received into the console:
```javascript theme={null}
// ...
controller.update = data => {
// Called when new data arrives
console.log(data);};
// ...
```
5. Remove the following code that creates the chart container and axis labels and pickers on the custom chart:
```javascript theme={null}
// Remove the code below
const chartContainer = document.createElement('div');
chartContainer.classList.add(styles.chartContainer);
controller.element.appendChild(chartContainer);
controller.createAxisLabel({
picks: 'Group By',
orientation: 'horizontal',
position: 'bottom',
popoverTitle: 'Group',
});
controller.createAxisLabel({
picks: 'Metric',
orientation: 'horizontal',
position: 'bottom',
});
```
6. Save the `src/index.js` file. The CLI updates the server’s copy with latest changes.
7. Preview the chart in the dashboard again (see [Step 5. Preview the Chart](/simba-embedded-analytics/docs/self-service-analytics/26.3/embed-and-extend/custom-charts/custom-chart-tut-ov#step-5-preview-the-chart)) and the chart’s data in the browser's console. Since the data is output to the browser’s console, open the browser’s developer tools to get to console. See instructions for [Google Chrome](https://developers.google.com/web/tools/chrome-devtools/) and [Mozilla Firefox](https://developer.mozilla.org/en-US/docs/Tools/Tools_Toolbox) browsers. The following image shows what the results might look like:
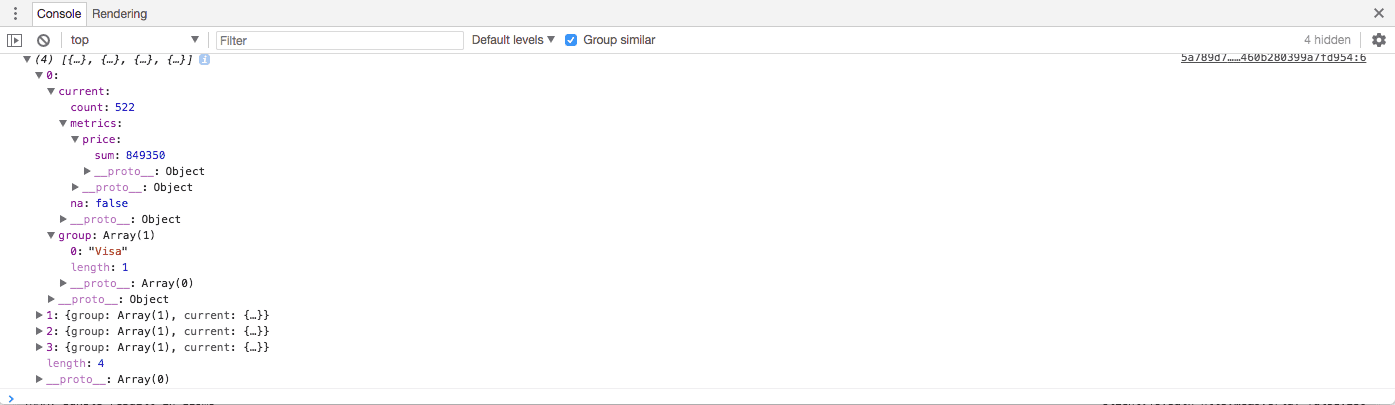 Notice the JSON array with multiple objects in the result. Each object contains a group property with an array of strings (one per group by field) and current object with a nested count property (# of records) and a metrics property (an object with the metrics requested). Each metric objects contains an aggregation function property, like sum and its resulting value.
To make flexible charts that can be used across data sources, without hard-coding, read on.
Notice the JSON array with multiple objects in the result. Each object contains a group property with an array of strings (one per group by field) and current object with a nested count property (# of records) and a metrics property (an object with the metrics requested). Each metric objects contains an aggregation function property, like sum and its resulting value.
To make flexible charts that can be used across data sources, without hard-coding, read on.
Step 3. Use Data Accessors
Now that we have captured the results of the chart’s query, we need to find a way to reshape the result set in a format that can be consumed by a charting library. We also want to ensure our charts remain flexible and applicable to multiple data sources. We do not want to hard-code any object properties in the code. Self-Service Analytics *data accessors*, exposed via the chart API, can be used to avoid hard-coding property names.
**Use data accessors**
1. Create some variables to hold the data accessors. We use one per query variable.
```javascript theme={null}
const groupAccessor = controller.dataAccessors['Group By']; // Group By is the name given to variable of type group.
const metricAccessor = controller.dataAccessors.Size; // Size is the name we gave to the variable of type metric.
```
The API is simple: `controller.dataAccessors[]`. Each data accessor holds the information about the field defined for the variable and provides a raw method that can be used to extract data values from a data object inside the returned data array.
2. Assume we want to reshape our data array so that the contained JSON object looks like:
```
{
name: STRING
value: NUMBER
}
```
With this information, let’s create a `reshapeData` function that takes the original Self-Service Analytics data array and returns a new array with the desired object structure, as follows:
```javascript theme={null}
function reshapeData(data) {
return data.map(d => ({
name: groupAccessor.raw(d),
value: metricAccessor.raw(d),
}));
}
```
3. Use the new `reshapeData` function to output the reshaped results into the console. The chart’s code should look like this:
```javascript theme={null}
/* global controller */
import styles from './index.css';
const groupAccessor = controller.dataAccessors['Group By'];
const metricAccessor = controller.dataAccessors.Size;
controller.update = function(data) {
// Called when new data arrives
console.log(reshapeData(data));
};
function reshapeData(data) {
return data.map(d => ({
name: groupAccessor.raw(d),
value: metricAccessor.raw(d),
}));
}
```
4. Refresh the dashboard with a copy of the chart and check the contents of the browser console.
Well Done! You have completed Part 2 of the custom chart tutorial, where you learned about query variables and data accessors, and how to reshape data to make the chart flexible and dynamic. Continue to [Part 3: Third-Party Charting Library Integration](/simba-embedded-analytics/docs/self-service-analytics/26.3/embed-and-extend/custom-charts/custom-chart-tut-ov-pt3).