> ## Documentation Index
> Fetch the complete documentation index at: https://insightsoftware.mintlify.site/llms.txt
> Use this file to discover all available pages before exploring further.
# Manage Custom Charts
> Describes how to manage custom charts.
Administrators can create custom charts using the custom chart CLI. Download, import, and delete custom charts in the user interface (UI). Custom charts can also be made visible on various menus in the Self-Service Analytics user interface (UI). By default, custom charts (visual types) are not visible until enabled for a source. See [Available Visual Types](/simba-embedded-analytics/docs/self-service-analytics/26.3/analyze-data/visuals/available-visual-types).
You must be an administrator to manage custom visual types.
* [Maintain Custom Charts Using the Custom Chart CLI](/simba-embedded-analytics/docs/self-service-analytics/26.3/embed-and-extend/custom-charts/custom-chart-maint-cli)
* [Manage Custom Charts in the UI](#manage-custom-charts-in-the-ui)
* [Visual Type Configuration Properties](/simba-embedded-analytics/docs/self-service-analytics/26.3/embed-and-extend/custom-charts/custom-chart-config)
* [Custom Chart API](/simba-embedded-analytics/docs/self-service-analytics/26.3/embed-and-extend/custom-charts/custom-chart-api-docs)
A step-by-step tutorial for creating a custom chart is also included in [A Custom Chart Tutorial](/simba-embedded-analytics/docs/self-service-analytics/26.3/embed-and-extend/custom-charts/custom-chart-tut-ov).
Manage Custom Charts in the UI
This section describes how you can manage custom charts in the Self-Service Analytics UI.
You must be an administrator to manage custom visual types.
* [List Custom Charts](#list-custom-charts)
* [Delete a Custom Chart](#delete-a-custom-chart)
* [Download a Custom Chart](#download-a-custom-chart)
* [Import a Custom Chart Using the UI](#import-a-custom-chart-using-the-ui)
You can also maintain custom charts using the CLI. See [Maintain Custom Charts Using the Custom Chart CLI](/simba-embedded-analytics/docs/self-service-analytics/26.3/embed-and-extend/custom-charts/custom-chart-maint-cli).
List Custom Charts
Custom charts that have been imported into Self-Service Analytics are listed on the Manage Custom Charts page in the UI.
**Access the Manage Custom Charts page**
1. Log into the user interface as an administrator.
2. Select **Tools** > **Custom Charts** from the Administration menu. The Manage Custom Charts page appears.
Your custom charts are listed in alphabetical order in the table on the Manage Custom Charts page.
Import a Custom Chart Using the UI
You can import a custom chart using the Self-Service Analytics UI as well as using the Logi Composer CLI. This topic describes how to import a custom chart using the UI. See [Maintain Custom Charts Using the Custom Chart CLI](/simba-embedded-analytics/docs/self-service-analytics/26.3/embed-and-extend/custom-charts/custom-chart-maint-cli) for information about using the CLI to import a custom chart.
**Import a custom chart using the user interface**
1. Log into the UI as an administrator.
2. Access the Manage Custom Charts page. See [List Custom Charts](#list-custom-charts).
3. Locate the Import Chart area of the Manage Custom Charts page.
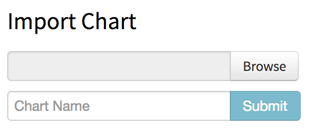 4. Select **Browse** and locate and select the `.zip` file of the custom chart you want to import.
5. Enter a visual name for the imported visual.
6. Select **Submit**. The visual is imported.
4. Select **Browse** and locate and select the `.zip` file of the custom chart you want to import.
5. Enter a visual name for the imported visual.
6. Select **Submit**. The visual is imported.
Download a Custom Chart
**Download a custom chart**
1. Log into the UI as an administrator.
2. Access the Manage Custom Charts page. See [List Custom Charts](#list-custom-charts).
3. Locate the visual in the table of visuals.
4. Select the download icon for the visual. The `.zip` file for the visual is downloaded.
When you download the visual from the Manage Custom Charts page, the zip file includes a file called `version` that contains the version of the Self-Service Analytics server. If you later try to import this zip file to a Self-Service Analytics server using a different version an error will occur indicating that the versions do not match. An easy workaround is to modify the version in the `version` file before trying the import.
Delete a Custom Chart
**Delete a custom chart**
1. Log into the UI as an administrator.
2. Access the Manage Custom Charts page. See [List Custom Charts](#list-custom-charts).
3. Locate the visual in the table of visuals.
4. Select the delete icon for the visual in the Delete column of the table.