> ## Documentation Index
> Fetch the complete documentation index at: https://insightsoftware.mintlify.site/llms.txt
> Use this file to discover all available pages before exploring further.
# Maintain Custom Charts Using the Custom Chart CLI
> Describes the custom chart management tasks you can perform using the custom chart CLI.
Self-Service Analytics’s Custom Chart Command Line Interface (CLI) allows developers to create, manage, and delete custom charts without being connected to the client application. The CLI tool uses `Node.js` and is installed locally via `npm`. Details about the custom chart CLI can also be found in [https://www.npmjs.com/package/composer-chart-cli](https://www.npmjs.com/package/composer-chart-cli).
Before installing Self-Service Analytics's custom chart CLI, verify that `Node.js` version 10 or later and `npm` version 5.6 or later are installed on your machine.
After it is installed and configured, the custom chart CLI behaves much like any other command line tool. You can build projects, run tests, and push new visuals using `npm` scripts. The custom chart CLI also supports the configuration of multimetric and group variables.
For a full list of common commands, see [Commands for the Custom Chart CLI](#commands-for-the-custom-chart-cli). A step-by-step tutorial for creating a custom chart can be found in [A Custom Chart Tutorial](/simba-embedded-analytics/docs/self-service-analytics/26.3/embed-and-extend/custom-charts/custom-chart-tut-ov).
This section covers the following topics:
* [Supported Custom Chart CLI Versions](#supported-custom-chart-cli-versions)
* [Install and Configure the Custom Chart CLI](#install-and-configure-the-custom-chart-cli)
* [Create a Custom Chart Using the CLI](#create-a-custom-chart-using-the-cli)
* [Install Dependencies and Build the Custom Chart Using the CLI](#install-dependencies-and-build-the-custom-chart-using-the-cli)
* [Edit the Custom Chart Using the CLI](#edit-the-custom-chart-using-the-cli)
* [Push the Custom Chart to the Server Using the CLI](#push-the-custom-chart-to-the-server-using-the-cli)
* [Remove a Custom Chart from the Server Using the CLI](#remove-a-custom-chart-from-the-server-using-the-cli)
* [List All Custom Charts on the Server Using the CLI](#list-all-custom-charts-on-the-server-using-the-cli)
* [Import a Custom Chart Using the CLI](#import-a-custom-chart-using-the-cli)
* [Custom Chart Support for Cross-Visual Links and Filters](/simba-embedded-analytics/docs/self-service-analytics/26.3/analyze-data/filters/published-enable#custom-chart-support-for-cross-visual-links-and-filters)
You can also perform some maintenance tasks for custom charts using the user interface. See [Manage Custom Charts in the UI](/simba-embedded-analytics/docs/self-service-analytics/26.3/embed-and-extend/custom-charts/custom-chart-managing#manage-custom-charts-in-the-ui).
Before installing Self-Service Analytics's custom chart CLI, verify that `Node.js` version 10 or later and `npm` version 5.6 or later are installed on your machine.
**Install and configure the custom chart CLI**:
1. Install the custom chart CLI by running the following:
```
$ npm install composer-chart-cli@ -g
```
2. After installation, you can configure the default environment that is used by the custom chart CLI. This makes creating and pushing custom charts easier, as you do not have to provide the server URL and credentials with every command. Run the following to start the configuration process:
```
$ cmp-chart config
```
3. Follow the prompts to store your default server configuration in an encrypted file. After the server configuration has been saved, the CLI checks for the presence of this file when you omit the server URL and credentials when running commands.
4. After installing, you can create new visuals or make updates to current custom charts.
Commands for the Custom Chart CLI
Access a list of custom chart CLI commands at any time by running `cmp-chart`. For help on any command, simply enter its name or enter `cmp-chart help`. For example, entering `cmp-chart init` without any parameters will show the help for the `cmp-chart init` command.
Self-Service Analytics Custom Chart CLI version 1 only supports the use of `vnd.composer.v3+json` as the `Content-Type` for API routes.
### Common Commands
| Command | Usage |
| --------------------------- | ---------------------------------------------------------------------------------------------------------------------- |
| [config](#cmp-chart-config) | Sets up an encrypted configuration of the servers URL and credentials. |
| [edit](#cmp-chart-edit) | Edits the visual's controls, components, libraries, variables, etc. Updates are not automatically pushed to the serve. |
| [help](#cmp-chart-help) | Provides help for the custom chart CLI. |
| [import](#cmp-chart-import) | Imports a visual in a zip file. |
| [init](#cmp-chart-init) | Creates a new visual in a folder you specify. |
| [ls](#cmp-chart-ls) | Lists the custom charts. |
| [push](#cmp-chart-push) | Pushes the bundled format of the visual to the server. |
| [rm](#cmp-chart-rm) | Removes a custom chart or library from the server. |
| [watch](#cmp-chart-watch) | Watches the changes in custom chart files and updates them. |
#### Syntax
cmp-chart config
```
$ cmp-chart config
```
Defines an encrypted configuration of Self-Service Analytics's server URL and admin credentials.
**Parameters**
* server (ex. [http://myserver.com:8080/discovery](http://myserver.com:8080/discovery))
* user name
* password
**Options**
* -h, --help output usage information
cmp-chart edit
```
$ cmp-chart edit
```
Edits a Self-Service Analytics custom chart.
You can edit the following elements:
* Components
* Controls
* Libraries
* Name
* Visibility
cmp-chart help
Provides help for the custom chart CLI. Alternatively, you get help for a specific command:
```
$ cmp-chart help
```
For example:
```
$ cmp-chart help import
```
cmp-chart import
```
$ cmp-chart import
```
Imports a custom chart to the Self-Service Analytics server.
**Options**
* -a, --app \[URL] Specify the Self-Service Analytics application server URL (e.g. [https://myserver/discovery](https://myserver/discovery))
* -u, --user \[user:password] Specify the user name and password to use for server authentication.
* -h, --help output usage information
cmp-chart init
```
$ cmp-chart init
```
Creates a custom chart.
**Options**
* -t, --type \ Specify the visual type. Valid values are single-group, multi-group, or raw. The default is single-group.
* -h, --help output usage information
cmp-chart ls
```
$ cmp-chart ls
```
Lists the custom charts you have created.
* -a, --app \[URL] Specify the Self-Service Analytics application server URL (e.g. [https://myserver/discovery](https://myserver/discovery))
* -u, --user \[user:password] Specify the user name and password to use for server authentication.
* -h, --help output usage information
cmp-chart push
```
$ cmp-chart push [options]
```
Pushes a custom chart in its current state to the Self-Service Analytics server.
**Options**
* -a, --app \[URL] Specify the Self-Service Analytics application server URL (e.g. [https://myserver/discovery](https://myserver/discovery))
* -d, --dir \[path/to/source/files] Directory used to look for the visual to push.
* -u, --user \[user:password] Specify the user name and password to use for server authentication.
* -h, --help output usage information
cmp-chart rm
```
$ cmp-chart rm [options]
```
Removes a custom chart from the Self-Service Analytics server.
**Options**
* -a, --app \[URL] Specify the Self-Service Analytics application server URL (e.g. [https://myserver/discovery](https://myserver/discovery))
* -u, --user \[user:password] Specify the user name and password to use for server authentication.
* -h, --help output usage information
cmp-chart watch
```
$ cmp-chart watch [options]
```
Watches for changes in custom chart files and updates them in the Self-Service Analytics server.
**Options**
* -a, --app \[URL] Specify the Self-Service Analytics application server URL (e.g. [https://myserver/discovery](https://myserver/discovery))
* -d, --dir \[path/to/source/files] Directory used to look for the visual to watch.
* -u, --user \[user:password] Specify the user name and password to use for server authentication.
* -h, --help output usage information
Create a Custom Chart Using the CLI
A complete example of creating a custom chart using the custom chart CLI can be found in [A Custom Chart Tutorial](/simba-embedded-analytics/docs/self-service-analytics/26.3/embed-and-extend/custom-charts/custom-chart-tut-ov).
Self-Service Analytics Custom Chart CLI version 1 only supports the use of `vnd.composer.v3+json` as the `Content-Type` for API routes.
**Create a custom chart locally using the custom chart CLI**
1. Open the Self-Service Analytics CLI.
2. Run the following command to create the visual.
```
$ cmp-chart init
```
Optionally, you can provide a type parameter. Valid values are `single-group`, `multi-group,` or `raw`. The default is `single-group`. For example:
```
$ cmp-chart init -t multi-group
```
The `cmp-chart init` command creates a directory in the specified path containing the files you need to get started. Here is a preview of the directory tree:
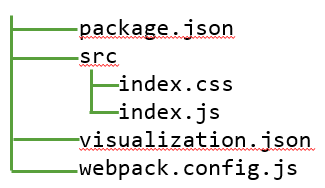 The following table describes the function of each file in the tree:
| File | Description |
| -------------------- | -------------------------------------------------------------------------------------------------------------------------------------------------------------------------------- |
| `package.json` | Lists the packages your visual depends on. For more information, see [https://docs.npmjs.com/creating-a-package-json-file](https://docs.npmjs.com/creating-a-package-json-file). |
| `src/index.css` | Your visual's CSS (style sheet) code. |
| `src/index.js` | Your visual's JavaScript code. Additional files can be used and imported into this file. |
| `visualization.json` | Contains the name, controls, and variables of your visual. |
| `webpack.config.js` | The [webpack configuration](https://webpack.js.org/configuration/). Webpack is used in visuals to bundle your code into a single file. |
The following table describes the function of each file in the tree:
| File | Description |
| -------------------- | -------------------------------------------------------------------------------------------------------------------------------------------------------------------------------- |
| `package.json` | Lists the packages your visual depends on. For more information, see [https://docs.npmjs.com/creating-a-package-json-file](https://docs.npmjs.com/creating-a-package-json-file). |
| `src/index.css` | Your visual's CSS (style sheet) code. |
| `src/index.js` | Your visual's JavaScript code. Additional files can be used and imported into this file. |
| `visualization.json` | Contains the name, controls, and variables of your visual. |
| `webpack.config.js` | The [webpack configuration](https://webpack.js.org/configuration/). Webpack is used in visuals to bundle your code into a single file. |
Edit the Custom Chart Using the CLI
**Edit a custom chart using the custom chart CLI**
Make sure you are in the visual’s folder and run the following edit command:
```
$ cmp-chart edit
```
Alternatively, you can specify the path to the visual in the edit command. For example:
```
$ cmp-chart edit -d
```
After running the edit command, follow the prompts to update the visual's controls, name, variables, or visibility.
When all edits are finished, be sure to rebuild the visual before pushing it to the server. See [Install Dependencies and Build the Custom Chart Using the CLI](#install-dependencies-and-build-the-custom-chart-using-the-cli).
Self-Service Analytics Custom Chart CLI version 1 only supports the use of `vnd.composer.v3+json` as the `Content-Type` for API routes.
Install Dependencies and Build the Custom Chart Using the CLI
To install dependencies and build the custom chart using the custom chart CLI:
1. Run the following command at the root level of the newly created custom chart to install dependencies:
```bash theme={null}
npm install
```
2. Run the following command at the root level of the custom chart to build the chart:
```
$ npm run build
```
Custom chart CLI version 5 only supports the use of `vnd.composer.v2+json` as the `Content-Type` for API routes. CLI version 4 only supports the use of `vnd.zoomdata.v2+json`.
Push the Custom Chart to the Server Using the CLI
**Push the custom chart to the server using the Custom Chart CLI**
Run the following command:
```
$ cmp-chart push
```
Self-Service Analytics Custom Chart CLI version 1 only supports the use of `vnd.composer.v3+json` as the `Content-Type` for API routes.
Import a Custom Chart Using the CLI
**Import a custom chart using the custom chart CLI**
Run the `cmp-chart import` command, specifying the path to the library. You can import visual zip files that were downloaded from the Manage Custom Charts page or a custom chart created with an older version of the CLI.
```
$ cmp-chart import [options]
```
where `` is the relative path to the zip file containing the visual you want to import.
The following options are available:
* `-a, -app [URL]` Specify the Self-Service Analytics application server URL (e.g. [https://myserver/discovery](https://myserver/discovery))
* `-u, -user [user:password]` Specify the user name and password to use for server authentication.
* `-h, -help` Output usage information
Self-Service Analytics Custom Chart CLI version 1 only supports the use of `vnd.composer.v3+json` as the `Content-Type` for API routes.
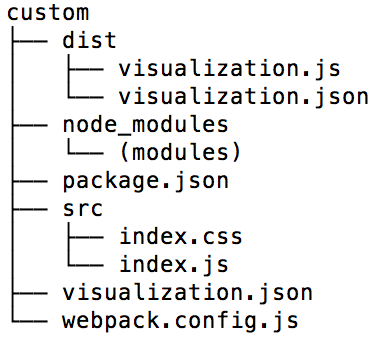
A custom chart is bundled before it is pushed to the Self-Service Analytics server. This creates a `/dist` directory containing the necessary files required to send the visual to the Self-Service Analytics server. This `/dist` custom chart zip file is not compatible with the `cmp-chart import` command and cannot be imported using the Manage Custom Charts page in the UI. To import the `/dist` custom chart zip file, use the `cmp-chart push` command instead.
List All Custom Charts on the Server Using the CLI
**List all custom charts stored on the Self-Service Analytics** **server using the Custom Chart CLI**
Run the following command:
```
$ cmp-chart ls
```
Self-Service Analytics Custom Chart CLI version 1 only supports the use of `vnd.composer.v3+json` as the `Content-Type` for API routes.
Remove a Custom Chart from the Server Using the CLI
**Remove a custom chart from the server using the Custom Chart CLI**
Run the following command:
```
$ cmp-chart rm
```
After running the command you will be prompted to select the visual name and confirm its deletion.
Self-Service Analytics Custom Chart CLI version 1 only supports the use of `vnd.composer.v3+json` as the `Content-Type` for API routes.
## Migrate Custom Charts
Custom charts in Self-Service Analytics can be created and managed using the Logi Composer Custom Chart CLI tool.
* Logi Composer Custom Chart CLI version 1 (`composer-chart-cli`) supports Logi Composer 7.10 and later.
* CLI version 6 (`zoomdata-chart-cli`) supports Composer 7.10 and earlier.
* CLI version 5 (`zoomdata-chart-cli`) supports Composer 7.9 and earlier.
Install Logi Composer Custom Chart CLI version 1 globally. Existing custom charts from older CLI versions (5 and 6) use the same directory structure as the Logi Composer Custom Chart CLI version 1 directory structure.
The following table lists the version of the CLI compatible with different versions of Self-Service Analytics.
| CLI Version | Supported Versions |
| ----------- | ------------------------------------------------------------------------------------------ |
| 1 | Logi Composer 7.10 and later. Self-Service Analytics 26.3 and later (`composer-chart-cli`) |
| 6 | Logi Composer 7.9 and later. (`zoomdata-chart-cli`) |
| 5 | Logi Composer 6.9 and through Logi Composer 7.8 and earlier. (`zoomdata-chart-cli`) |
### File Structure
The custom chart file structure for supported versions of custom charts:
* Logi Composer Custom Chart CLI v1 (`composer-chart-cli`)
* CLI v6 (`zoomdata-chart-cli`)
* CLI v5 (`zoomdata-chart-cli`)
##### Custom Chart CLI File Structure
 ### API Route Differences
Composer Custom Chart CLI version 1 only supports the use of `vnd.composer.v3+json` as the `Content-Type` for API routes.
### CLI Commands
The command differences between CLI versions are described in the following table:
| Command v1 | Command v5/v6 | Description |
| ---------------------------------- | --------------------------------- | ------------------------------------------------------------------------------- |
| `cmp-chart import ` | `zd-chart import ` | Import a visual in a zip file. |
| `cmp-chart init` | `zd-chart init` | Create a new visual in a folder you specify. |
| `cmp-chart edit` | `zd-chart edit` | Update the visual locally, but no longer push the updated visual to the server. |
| `cmp-chart push` | `zd-chart push` | Push a custom chart to the server. |
| `cmp-chart watch` | `zd-chart watch` | Watch changes in the `src` directory and pushes them to the server. |
If you need to migrate custom charts from an unsupported version of Logi Composer, contact [Technical Support](/simba-embedded-analytics/docs/self-service-analytics/26.3/get-started/tech-support) for assistance.
### API Route Differences
Composer Custom Chart CLI version 1 only supports the use of `vnd.composer.v3+json` as the `Content-Type` for API routes.
### CLI Commands
The command differences between CLI versions are described in the following table:
| Command v1 | Command v5/v6 | Description |
| ---------------------------------- | --------------------------------- | ------------------------------------------------------------------------------- |
| `cmp-chart import ` | `zd-chart import ` | Import a visual in a zip file. |
| `cmp-chart init` | `zd-chart init` | Create a new visual in a folder you specify. |
| `cmp-chart edit` | `zd-chart edit` | Update the visual locally, but no longer push the updated visual to the server. |
| `cmp-chart push` | `zd-chart push` | Push a custom chart to the server. |
| `cmp-chart watch` | `zd-chart watch` | Watch changes in the `src` directory and pushes them to the server. |
If you need to migrate custom charts from an unsupported version of Logi Composer, contact [Technical Support](/simba-embedded-analytics/docs/self-service-analytics/26.3/get-started/tech-support) for assistance.
Supported Custom Chart CLI Versions
Custom charts in Self-Service Analytics can be created and managed using the Custom Chart CLI tool.
Logi Composer Custom Chart CLI version 1 (`composer-chart-cli`) supports Logi Composer 7.10 and later, through this current release.
Logi Composer Custom Chart CLI version 1 only supports the use of `vnd.composer.v3+json` as the `Content-Type` for API routes.
A custom chart is bundled before it is pushed to the Self-Service Analytics server. Bundling can be accomplished using a tool such as webpack. This creates a `/dist` directory containing the necessary files required to send the visual to the server.
Existing custom charts from older CLI versions use the same directory structure as the Logi Composer Custom Chart CLI version 1 directory structure.