> ## Documentation Index
> Fetch the complete documentation index at: https://insightsoftware.mintlify.site/llms.txt
> Use this file to discover all available pages before exploring further.
# Hierarchical Fields and Structures
> Describes support for hierarchical fields and structures.
Hierarchical fields are enabled by default at the server level. Work with [Technical Support](/simba-embedded-analytics/docs/self-service-analytics/26.3/get-started/tech-support) to disable.
Self-Service Analytics supports common hierarchical structures you can use to visualize and organize your data. Hierarchies create parent-child tree-based, and field-level hierarchical structures using your source data.
When you organize your data in hierarchies, it's easier to access for analytical processing, for data traversal, and keyword searching. To view your data in a hierarchical format, create a data source that defines a hierarchy using data in an adjacency list structure, add one or more hierarchy fields to your source, and use the hierarchical field in the context of a group or filter on pivot table visuals or other visuals.
See the following topics for more information:
* [Define a Hierarchical Source](#define-a-hierarchical-source)
* [Edit a Hierarchical Source](#edit-a-hierarchical-source)
* [Define a Hierarchy Field for Your Source](#define-a-hierarchy-field-for-your-source)
* [Filter by Hierarchy Field](/simba-embedded-analytics/docs/self-service-analytics/26.3/analyze-data/filters/filters-attr#filter-by-hierarchy-field)
* [Apply Hierarchical Groups](#apply-hierarchical-groups)
* [Apply Hierarchical Filters to a Pivot Table Visual](#apply-hierarchical-filters-to-a-pivot-table-visual)
* [Apply Hierarchical Filters to Visuals](#apply-hierarchical-filters-to-visuals)
* [Sunburst](/simba-embedded-analytics/docs/self-service-analytics/26.3/analyze-data/visuals/pie#sunburst)
## Limitations
* Cycles in hierarchies are not supported.
* Hierarchical groups are available in the Pivot Table visual as a single hierarchical group in rows.
* Hierarchical groups are available as multiple groups in the Sunburst visual.
* When you use a hierarchical group, simple metrics are calculated for all hierarchy levels by default. Specify **Use Rollup** to roll data up to parent levels as needed in pivot tables.
* Data sharpening and viewing data changes using the time bar are not available.
* By default, simple metrics are included; enable **Use Rollup** to roll data up to the parent levels in pivot tables.
* Aggregate filters are not available.
* Pagination is not supported in pivot table visuals that use hierarchical groups. To view your entire hierarchy, adjust the rows per page limit to accommodate all items of the hierarchy.
Define a Hierarchical Source
Hierarchical fields are enabled by default at the server level. Work with [Technical Support](/simba-embedded-analytics/docs/self-service-analytics/26.3/get-started/tech-support) to disable.
In this release, when your admin enables the Enhanced Experience user interface, you will see changes to workflows you may have used in previous releases.
Create or edit a source to include a facts table and at least one lookup table to create your hierarchical source.
### Define a New Hierarchical Source
1. Log in as a user with the **Administer Sources** or **Create New Data Sources** [privilege](/simba-embedded-analytics/docs/self-service-analytics/26.3/administer/users/aaa-ov#group-privilege-reference).
2. Select the **Sources** card on your home page or **Data Sources** from the main menu. The [Sources](/simba-embedded-analytics/docs/self-service-analytics/26.3/connect-to-data/sources/data-source-config-overview#data-sources-page) page appears.
3. On the [Sources](/simba-embedded-analytics/docs/self-service-analytics/26.3/connect-to-data/sources/data-source-config-overview#data-sources-page) page, select the **Create Source** button. The [Source Creation](/simba-embedded-analytics/docs/self-service-analytics/26.3/connect-to-data/sources/data-source-config-source-creation-tab) work area opens.
4. Name your source, then add the first data entity, including appropriate connection, schema, and entity options or Custom SQL.
The first data entity can be, but does not have to be, the facts table.
5. Add the second data entity, your hierarchy lookup table, including appropriate connection, schema, and entity options, or Custom SQL.
6. Select **Add** in the Join Definition work area to connect the hierarchy lookup table to the facts table.
7. If only one hierarchy is used, we recommend you use a left join from a hierarchy lookup table to a facts table. To configure multiple hierarchical tables on a single source, contact [Technical Support](/simba-embedded-analytics/docs/self-service-analytics/26.3/get-started/tech-support).
* Select a left join to preserve the contents and structure of the hierarchical tree, regardless of the contents of the facts table.
* If you select an inner join, the hierarchy is limited to data in the facts table. This may break your hierarchy structure, separating nested items from parents, making the nest items top-level items.
You can visualize your joins by selecting the view icon in the Joins work area. See [Visualize Joins](/simba-embedded-analytics/docs/self-service-analytics/26.3/connect-to-data/sources/data-fusion-overview#visualize-joins).
8. Select **Apply** to create the join, then **Save Source** to save your source.
Next, define a hierarchy field for your source. See [Define a Hierarchy Field for Your Source](#define-a-hierarchy-field-for-your-source).
Edit a Hierarchical Source
Hierarchical fields are enabled by default at the server level. Work with [Technical Support](/simba-embedded-analytics/docs/self-service-analytics/26.3/get-started/tech-support) to disable.
You can edit an existing source to pair a facts table and at least one lookup table to use hierarchical data.
In this release, when your admin enables the Enhanced Experience user interface, you will see changes to workflows you may have used in previous releases.
**Edit a source**
1. Log in as a user with the **Administer Sources** or **Create New Data Sources** [privilege](/simba-embedded-analytics/docs/self-service-analytics/26.3/administer/users/aaa-ov#group-privilege-reference).
2. Select the **Sources** card on your home page or **Data Sources** from the main menu. The [Sources](/simba-embedded-analytics/docs/self-service-analytics/26.3/connect-to-data/sources/data-source-config-overview#data-sources-page) page appears.
3. On the [Sources](/simba-embedded-analytics/docs/self-service-analytics/26.3/connect-to-data/sources/data-source-config-overview#data-sources-page) page, select a source to edit. The [Source Creation](/simba-embedded-analytics/docs/self-service-analytics/26.3/connect-to-data/sources/data-source-config-source-creation-tab) work area opens.
4. In this example, the existing data entity is the fact table. Select **Add** to add a data entity to use as a hierarchical lookup table.
5. Select **Add** in the Join Definition work area to connect the hierarchy lookup table to the facts table.
6. If only one hierarchy is used, we recommend you use a left join from a hierarchy lookup table to a facts table.
* Select a left join to preserve the contents and structure of the hierarchical tree, regardless of the contents of the facts table.
* If you select an inner join, the hierarchy is limited to data in the facts table. This may break your hierarchy structure, separating nested items from parents, making the nest items top-level items.
You can visualize your joins by selecting the view icon in the Joins work area. See [Visualize Joins](/simba-embedded-analytics/docs/self-service-analytics/26.3/connect-to-data/sources/data-fusion-overview#visualize-joins).
7. Select **Apply** to create the join, then **Save Source** to save your source.
8. Next, [define a hierarchy field](#define-a-hierarchy-field-for-your-source) for your source.
Define a Hierarchy Field for Your Source
Hierarchical fields are enabled by default at the server level. Work with [Technical Support](/simba-embedded-analytics/docs/self-service-analytics/26.3/get-started/tech-support) to disable.
After you have created your source, define a hierarchy field for your source. Once you have defined a hierarchy field, you can create a table visual or pivot table visual that uses your hierarchical data.
### Add a Hierarchy Field
1. Open the Fields tab of your hierarchical source.
2. Select **Add Hierarchy Field**. The Add Hierarchy Field work area opens.
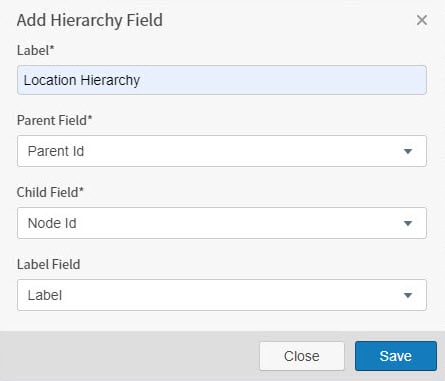 3. Select a **Parent Field**, a **Child Field**, and optionally select a **Label Field** if applicable. If you do not select a Label Field, the value selected for Child Field is used.
* A parent field references another row from the same table using a unique identifier or unique name. This establishes the parent-child relationship. The parent and child fields must be the same field type, either an attribute or number.
* A child field contains a unique identifier or unique name of an element in the hierarchical tree, unique within the scope of the table. The parent and child fields must be the same field type, either an attribute or number.
* A label field contains a user friendly name of a hierarchy element. This optional field is visible on the visual if configured. This field does not need to be unique.
4. Select **Save** to save your new hierarchy field.
3. Select a **Parent Field**, a **Child Field**, and optionally select a **Label Field** if applicable. If you do not select a Label Field, the value selected for Child Field is used.
* A parent field references another row from the same table using a unique identifier or unique name. This establishes the parent-child relationship. The parent and child fields must be the same field type, either an attribute or number.
* A child field contains a unique identifier or unique name of an element in the hierarchical tree, unique within the scope of the table. The parent and child fields must be the same field type, either an attribute or number.
* A label field contains a user friendly name of a hierarchy element. This optional field is visible on the visual if configured. This field does not need to be unique.
4. Select **Save** to save your new hierarchy field.
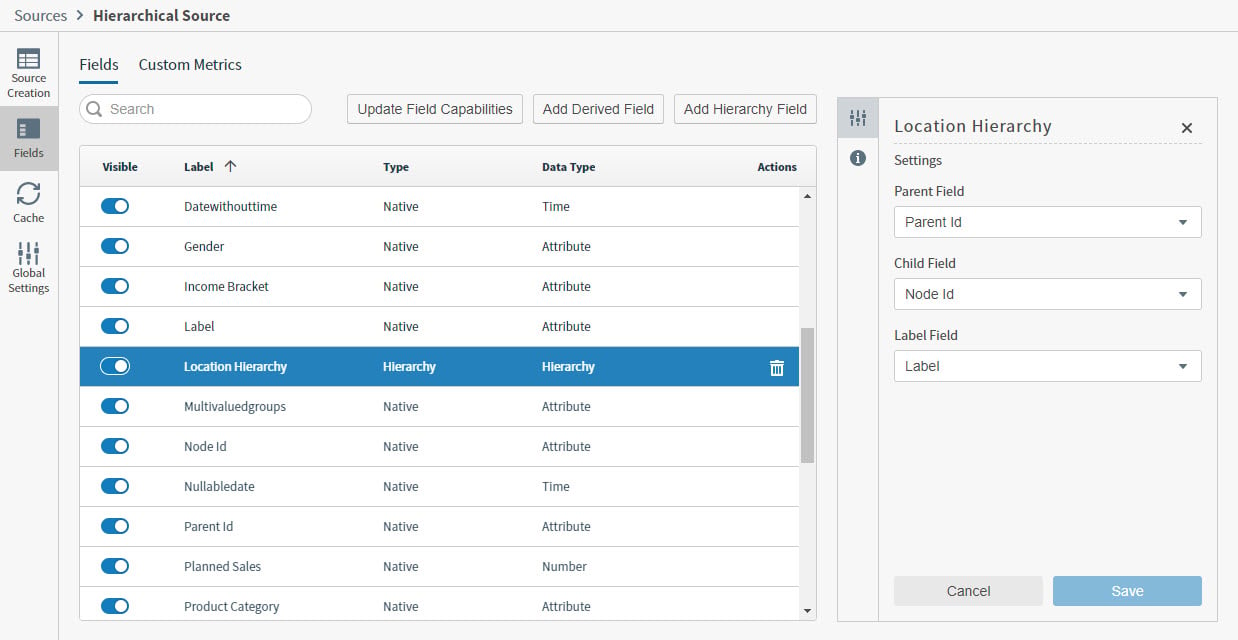 5. Optionally, disable the Time Bar on the General Settings tab, and select **Save Settings** to save your changes.
After you have defined a hierarchical field, you can:
* Create a table visual or pivot table using the hierarchical data referenced by this hierarchy field.
* Filter data using this hierarchical field in a [filter](/simba-embedded-analytics/docs/self-service-analytics/26.3/analyze-data/filters/filters-attr#filter-in-a-visual-or-dashboard) or [filter snippet](/simba-embedded-analytics/docs/self-service-analytics/26.3/analyze-data/filters/filters-attr#create-a-filter-snippet-hierarchy-data-type).
5. Optionally, disable the Time Bar on the General Settings tab, and select **Save Settings** to save your changes.
After you have defined a hierarchical field, you can:
* Create a table visual or pivot table using the hierarchical data referenced by this hierarchy field.
* Filter data using this hierarchical field in a [filter](/simba-embedded-analytics/docs/self-service-analytics/26.3/analyze-data/filters/filters-attr#filter-in-a-visual-or-dashboard) or [filter snippet](/simba-embedded-analytics/docs/self-service-analytics/26.3/analyze-data/filters/filters-attr#create-a-filter-snippet-hierarchy-data-type).
Apply Hierarchical Groups
Hierarchical fields are enabled by default at the server level. Work with [Technical Support](/simba-embedded-analytics/docs/self-service-analytics/26.3/get-started/tech-support) to disable.
### Use a Hierarchical Group in a Pivot Table
1. Create a pivot table visual from your hierarchical data source.
2. Select the Settings sidebar menu, then select **Edit Row Groups** ( ).
).
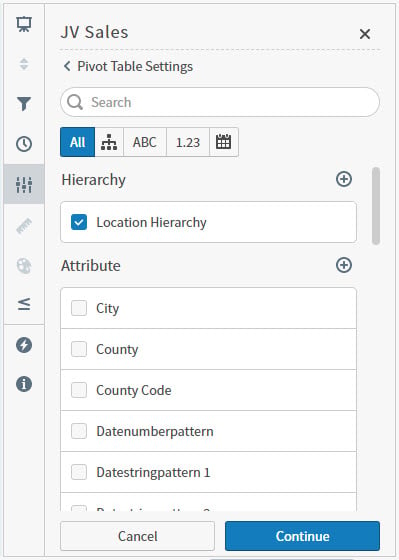 3. Select a hierarchical field to use, then select **Continue** to define column groups and metrics for your visual.
You can not use other fields in row groups if you have selected a hierarchical field. The hierarchical field will be the only row in the rows dimension.
4. Optionally, select **Edit Column Group** () to add a field or fields to column groups.
5. Select metrics to use in your pivot table. Optionally, enable **Rollup** for the metrics, if supported. This shows the rolled up value of all child values at each hierarchy level.
6. Select **Apply** to apply your changes. You can now expand and collapse the hierarchical data you defined in your visual.
Not all data in your sources may display in your visual due to rows per page settings. The default display of rows is 200, including the parents and root node. Adjust the **Rows per Page** in the Display Settings.
3. Select a hierarchical field to use, then select **Continue** to define column groups and metrics for your visual.
You can not use other fields in row groups if you have selected a hierarchical field. The hierarchical field will be the only row in the rows dimension.
4. Optionally, select **Edit Column Group** () to add a field or fields to column groups.
5. Select metrics to use in your pivot table. Optionally, enable **Rollup** for the metrics, if supported. This shows the rolled up value of all child values at each hierarchy level.
6. Select **Apply** to apply your changes. You can now expand and collapse the hierarchical data you defined in your visual.
Not all data in your sources may display in your visual due to rows per page settings. The default display of rows is 200, including the parents and root node. Adjust the **Rows per Page** in the Display Settings.
Apply Hierarchical Filters to a Pivot Table Visual
Hierarchical fields are enabled by default at the server level. Work with [Technical Support](/simba-embedded-analytics/docs/self-service-analytics/26.3/get-started/tech-support) to disable.
### Apply a Hierarchical Filter to a Pivot Table
1. Open the Filter sidebar menu of a pivot table that uses a hierarchical group.
2. Select **Add Filter**. The Add Filter work area opens.
3. On the Row tab, select an available Hierarchy to filter. The Select Values work area opens.
The default Operator, **Equals or Descendants Of**, is selected. When used in this filter, Self-Service Analytics selects data for nodes equal to the selected node, and its descendants. You can select multiple nodes in a hierarchical filter, but not deselect child nodes.
If you select the Operator **includes**, Self-Service Analytics selects data for nodes equal to the selected node, and its descendants. You can select multiple nodes in a hierarchical filter, and optionally deselect child nodes.
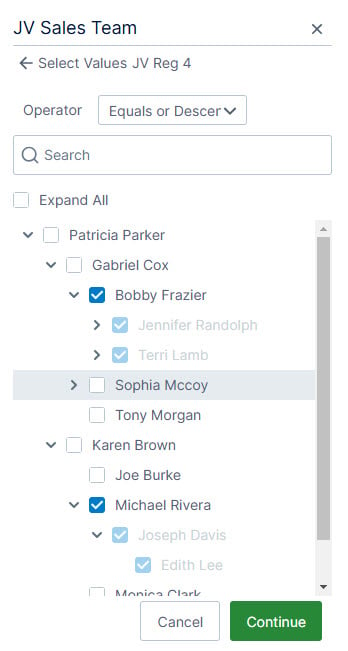 4. Select one or more nodes to filter your data. At least one filter value is required.
* Use the **Search** box to find specific nodes.
* Select the node indicators to expand and collapse nodes, or select and deselect **Expand All** to expand and collapse all nodes.
5. Select **Continue** to apply your changes.
6. Optionally, add any other filters you need.
7. Select **Apply** to apply your filters to the pivot table.
4. Select one or more nodes to filter your data. At least one filter value is required.
* Use the **Search** box to find specific nodes.
* Select the node indicators to expand and collapse nodes, or select and deselect **Expand All** to expand and collapse all nodes.
5. Select **Continue** to apply your changes.
6. Optionally, add any other filters you need.
7. Select **Apply** to apply your filters to the pivot table.
Apply Hierarchical Filters to Visuals
Hierarchical fields are enabled by default at the server level. Work with [Technical Support](/simba-embedded-analytics/docs/self-service-analytics/26.3/get-started/tech-support) to disable.
### Apply a Hierarchical Filter to a Table Visual
1. Open the Filter sidebar menu of a visual that uses a hierarchical data source.
2. Select **Add Filter**. On the row tab, select an available Hierarchy to filter. The Select Values work area opens.
The default Operator, **Equals or Descendants Of**, is selected. When used in this filter, Self-Service Analytics selects data for nodes equal to the selected node, and its descendants.
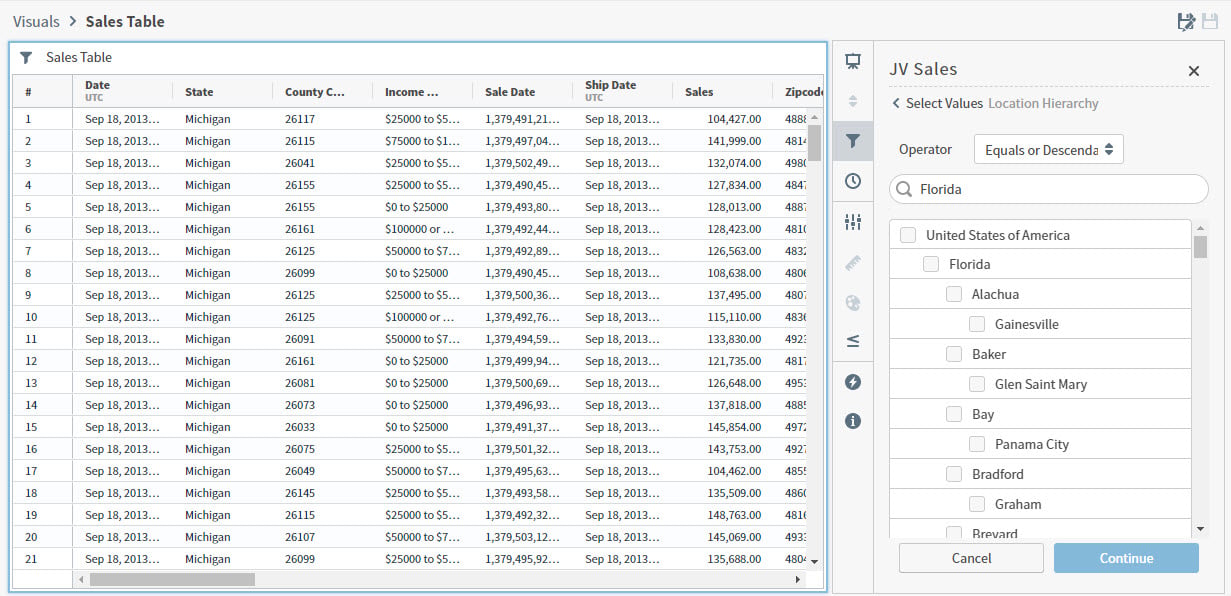 3. Select one or more nodes to filter your data. At least one filter value is required.
* Use the **Search** box to find specific nodes.
* Select the node indicators to expand and collapse nodes, or select and deselect **Expand All** to expand and collapse all nodes.
4. Select **Continue** to apply your changes.
5. Optionally, add any other filters you need.
6. Select **Apply** to apply your filters to the visual.
3. Select one or more nodes to filter your data. At least one filter value is required.
* Use the **Search** box to find specific nodes.
* Select the node indicators to expand and collapse nodes, or select and deselect **Expand All** to expand and collapse all nodes.
4. Select **Continue** to apply your changes.
5. Optionally, add any other filters you need.
6. Select **Apply** to apply your filters to the visual.