> ## Documentation Index
> Fetch the complete documentation index at: https://insightsoftware.mintlify.site/llms.txt
> Use this file to discover all available pages before exploring further.

# Use Data Sharpening

> Describes Data Sharpening in your software.

Data Sharpening™ is insightsoftware's patented technique to deliver fast and responsive visuals for large volumes of data. Conceptually, Data Sharpening is similar to the way large image files or streaming video files display in a browser. When you start to load the image file, you see a blurry approximation of the image. But as the file loads in the background, the image sharpens until the entire image eventually comes into clear focus.

When you create or modify a visual for a large data set in Self-Service Analytics, Data Sharpening immediately displays a partial or approximate rendering of the data. It then continuously updates the visual with more and more data until the fully sharpened result is available.

While the visual sharpens, you can continue to interact with it, zooming into more detail or changing the Group By attribute without waiting for the entire query to return. Essentially, you can continue your big data exploration without waiting for long-running queries over billions of rows of data to complete. Self-Service Analytics adjusts on-the-fly based on your input. One thing to keep in mind—Data Sharpening may not always be needed when visualizing your data. If Self-Service Analytics is able to complete its query of the data quickly (within a few seconds), you will simply see the final result rendered in the visual. Data Sharpening is a tool that is leveraged when the visual may not render immediately due to the volume of the data being queried.

See the following topics:

* [Data Sharpening Prerequisites](#data-sharpening-prerequisites)
* [When Data Sharpening Occurs](#when-data-sharpening-occurs)
* [Enable Data Sharpening and Configure Its Defaults](#enable-data-sharpening-and-configure-its-defaults)
* [Enable Data Sharpening for Cloudera Impala Data Sources](/simba-embedded-analytics/docs/self-service-analytics/26.3/connect-to-data/connectors/cloudera-ov#enable-data-sharpening-for-cloudera-impala-data-sources)

<h2 id="data-sharpening-prerequisites">
  Data Sharpening Prerequisites
</h2>

Before you use Data Sharpening, verify that your data source configuration has enabled it. See [Enable Data Sharpening and Configure Its Defaults](#enable-data-sharpening-and-configure-its-defaults).

Before Self-Service Analytics can perform Data Sharpening with a data source, a "playable" time field is required. Self-Service Analytics attempts to automatically detect this playable field from your data source when it is defined. To determine what makes a time attribute "playable," refer to the table below. In addition, an appropriate time attribute must be specified in your data source's global default settings on the Visuals page of the data source configuration. The granularity of this time field is referred to as the *driving time field granularity* (DTFG) and plays an important role in determining whether and how Data Sharpening is executed (see [When Data Sharpening Occurs](#when-data-sharpening-occurs)). See [Enable Data Sharpening and Configure Its Defaults](#enable-data-sharpening-and-configure-its-defaults) to learn how to enable Data Sharpening for your connected data sources.

Data Sharpening setup differs slightly depending on the data source. Although a playable time field is required for sharpening to occur, the time field requirement is based on the data source. The table below lists the time field requirements for different data stores supported in Self-Service Analytics.

<table>
  <thead>
    <tr>
      <th scope="col">Data Store</th>
      <th scope="col">Time Field Requirement</th>
    </tr>
  </thead>

  <tbody>
    <tr>
      <td>Amazon Redshift</td>
      <td>Sort Key (only the first sort key is selected)</td>
    </tr>

    <tr>
      <td>Cloudera Impala, Hive</td>
      <td>Partitioned time field (The time field that is partitioned needs to be configured from the "Fields" page. A single partitioned column is needed for Data Sharpening to work in Impala or Hive sources.)</td>
    </tr>

    <tr>
      <td>Search-based sources <br />(Cloudera Search, Elasticsearch, Apache Solr)</td>
      <td>Indexed time field\*. Self-Service Analytics automatically detects for indices.</td>
    </tr>

    <tr>
      <td>SQL-based sources <br />(MySQL, Oracle, PostgreSQL, SQL Server)</td>
      <td>Indexed time field\*. Self-Service Analytics automatically detects for indices.</td>
    </tr>

    <tr>
      <td colSpan={2}>
        <Note>
          The indexed time field should already be set in the data source, so no additional configuration is needed in Self-Service Analytics.
        </Note>
      </td>
    </tr>
  </tbody>
</table>

<h2 id="when-data-sharpening-occurs">
  When Data Sharpening Occurs
</h2>

When Self-Service Analytics connects to your data source for the first time, it runs an initial query to return a sample of the data set—approximately 100 rows of data—to provide an initial time range. Meanwhile, it continues to run a comprehensive query to obtain the actual MIN/MAX range based on the entire data set. In this instance, based on the results of the sample query, Data Sharpening may not activate because the time range and time granularity results fall short of the criteria for sharpening to execute. However, after Self-Service Analytics completes the full query, Data Sharpening works as expected as long as the correct parameters have been applied and the time criteria are met. Depending on the size of your data set, the comprehensive query process may take a few minutes to complete its execution (additional constraints include the size and type of the data source and other factors such as competing resources on the database and resource and performance limitations).

Bear in mind that Self-Service Analytics connects to and runs queries in your original data source and can be resource intensive. The full query runs in the background at the same time as a series of microqueries that sample data across partitions and refine estimates.

When you create a visual, Self-Service Analytics determines whether Data Sharpening is necessary based on the visual type you select and the time attribute parameters you set for it.

* For non-trend visuals (such as [bars](/simba-embedded-analytics/docs/self-service-analytics/26.3/analyze-data/visuals/available-visual-types#bar-chart-styles), [donut charts](/simba-embedded-analytics/docs/self-service-analytics/26.3/analyze-data/visuals/pie#donut-charts), and [heat maps](/simba-embedded-analytics/docs/self-service-analytics/26.3/analyze-data/visuals/scatter-plot#heat-maps)), the granularity of the driving time field must be less than 10% of the range that is set in the time bar (determined by the MIN/MAX range set in the data source). The minimum granularity used by Self-Service Analytics will *always* be **minutes**. Thus, even if your driving time field granularity (DTFG) is **seconds**, Self-Service Analytics will use **minutes** when performing this 10% rule calculation.
* For trend visuals (such as [line and bars trend](/simba-embedded-analytics/docs/self-service-analytics/26.3/analyze-data/visuals/bar-standard#edit-line-bar-trend-charts) and [line trend attribute value](/simba-embedded-analytics/docs/self-service-analytics/26.3/analyze-data/visuals/bar-standard#line-trend-attribute-value-charts) charts), Self-Service Analytics runs an internal check to determine whether Data Sharpening should execute. Similar to the non-trend visuals, a 10% criteria is used, but it is slightly modified for the trend visual scenario. If the granularity of the driving time field for the source is less than 10% of the time granularity used in the particular trend visual, then Data Sharpening executes.

The bottom line is that Self-Service Analytics tries to perform Data Sharpening when warranted based on the size of the data set, the time attributes available, and the time granularity that is set. If Self-Service Analytics determines that results can be rendered in the visual quickly without Data Sharpening, it does so. Otherwise, it attempts to use Data Sharpening to return near instantaneous result sets that are refined over time until the query completes.

<h2 id="enable-data-sharpening-and-configure-its-defaults">
  Enable Data Sharpening and Configure Its Defaults
</h2>

To enable and configure Data Sharpening for a data source, you need to enable the time settings in the data source's settings page. Specifically, a playable time field must be specified in the Global Settings tab of the data source configuration. However, Cloudera Impala data sources require additional configuration as described in [Enable Data Sharpening for Cloudera Impala Data Sources](/simba-embedded-analytics/docs/self-service-analytics/26.3/connect-to-data/connectors/cloudera-ov#enable-data-sharpening-for-cloudera-impala-data-sources).

**Configure Data Sharpening in a data source configuration**

1. Log into Self-Service Analytics (either as an administrator or as a user who has been assigned to a group with [data source management privileges](/simba-embedded-analytics/docs/self-service-analytics/26.3/administer/users/aaa-ov#group-privilege-reference)).

2. Select the **Sources** card on your home page or **Data Sources** from the main menu. The [Sources](/simba-embedded-analytics/docs/self-service-analytics/26.3/connect-to-data/sources/data-source-config-overview#data-sources-page) page appears.

3. In the table on the Sources page, locate and select the data source configuration you want to edit.

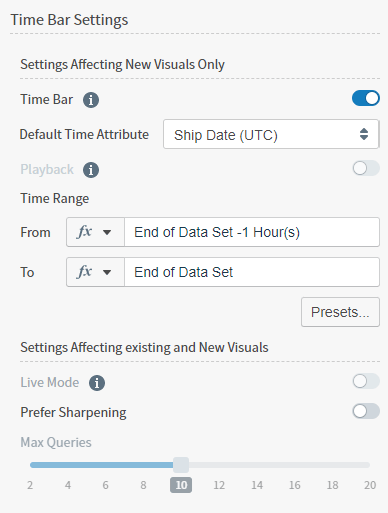
4. Select the **Global Settings** tab. The time bar, search, and Data Sharpening settings for the data source appears.

   <img src="https://mintcdn.com/insightsoftware/1fCfZrK84x8KmAw8/simba-embedded-analytics/docs/self-service-analytics/26.3/images/source-creation/time-bar-settings-full-710.png?fit=max&auto=format&n=1fCfZrK84x8KmAw8&q=85&s=79f6b7d55fb35a27b8aa51ffc7ed27d4" alt="" width="388" height="513" data-path="simba-embedded-analytics/docs/self-service-analytics/26.3/images/source-creation/time-bar-settings-full-710.png" />

5. Make sure **Time Bar** is enabled to access Data Sharpening settings. If Time Bar is disabled, you can not configure Data Sharpening settings. For more information about time bar default settings, see [Configure Time Bar Defaults](/simba-embedded-analytics/docs/self-service-analytics/26.3/connect-to-data/sources/data-source-config-global-settings-tab#configure-time-bar-defaults).

6. Slide the **Prefer Sharpening** switch to the right to enable Data Sharpening for the data source.

7. Optionally, use the **Max Queries** slider to specify the maximum number of queries used for Data Sharpening. The default maximum is 10 queries.

8. When your changes are complete, select **Save Settings** to save your changes.