> ## Documentation Index
> Fetch the complete documentation index at: https://insightsoftware.mintlify.site/llms.txt
> Use this file to discover all available pages before exploring further.

# Use the Visual Gallery

> Describes the visual gallery.

Use the Visual Gallery to view and manage the visuals defined in a Self-Service Analytics instance and shared with other users.

You must be logged in as a user in a group with the **Administer Visuals** privilege to see the Visual Gallery. Read, write, and delete permissions for a visual gallery visual are controlled by the permissions assigned the data source used by the visual in combination with the user's group [privileges](/simba-embedded-analytics/docs/self-service-analytics/26.3/administer/users/aaa-ov#group-privilege-reference).

As creator and owner of a visual, you are automatically granted read, write, and delete for the visual in the Visual Gallery. When you remove a user who has created visuals from the system, items created by that user are retained.

<Note>
  Local visuals exist only on the dashboard on which they were created. Convert to a Visual Gallery visual and add to the Visual Gallery at any time. Visual gallery visuals can be converted to a local visual at any time. See [Convert Visual Gallery Visuals and Local Visuals](/simba-embedded-analytics/docs/self-service-analytics/26.3/analyze-data/visuals/visual-add-dash#convert-visual-gallery-visuals-and-local-visuals).
</Note>

If you log in as a user who has not been granted [permissions](/simba-embedded-analytics/docs/self-service-analytics/26.3/connect-to-data/sources/ds-permissions) for any visuals, the work area displays a message indicating that no visuals are available.

<Note>
  In this release, when your admin enables the Enhanced Experience user interface, you will see changes to workflows you may have used in previous releases.
</Note>

## Access the Visual Gallery

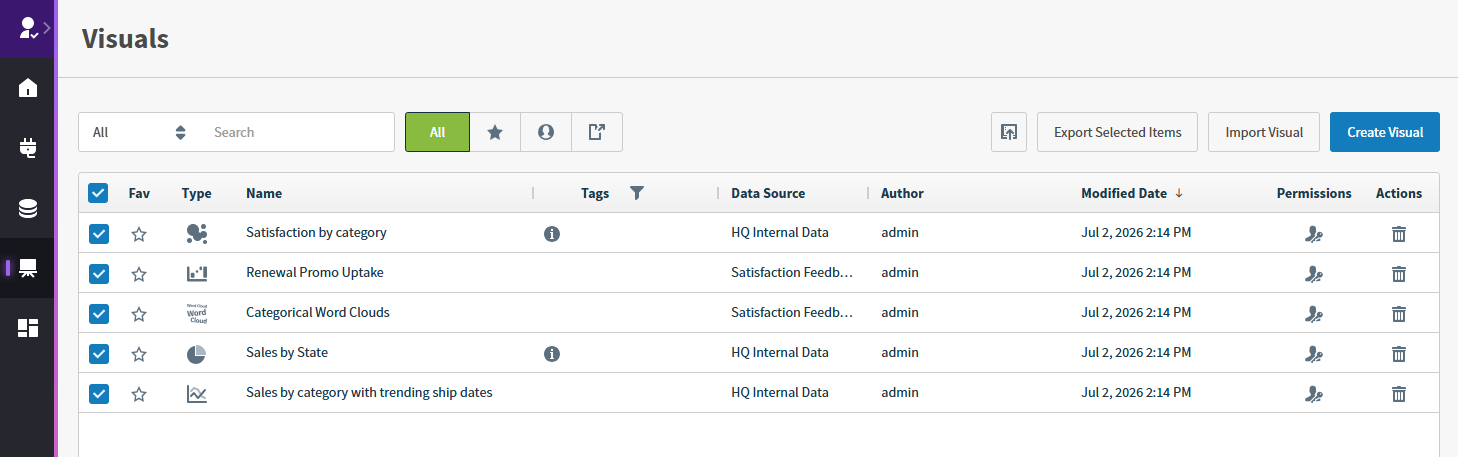
To access the visual gallery, log in as an administrator or as a user with the **Administer Visuals** [privilege](/simba-embedded-analytics/docs/self-service-analytics/26.3/administer/users/aaa-ov#group-privilege-reference).Select **Visual Gallery** from the main menu. The Visuals library appears, and visuals are listed in a table format.

<img src="https://mintcdn.com/insightsoftware/b9ogX_L4Mqut_Uxb/simba-embedded-analytics/docs/self-service-analytics/26.3/images/v26/work-areas/visuals/vis-lib-26-2.png?fit=max&auto=format&n=b9ogX_L4Mqut_Uxb&q=85&s=892974dbeb464ea5be9219f6d7c111fc" alt="use this work area to manage your visuals" width="1458" height="457" data-path="simba-embedded-analytics/docs/self-service-analytics/26.3/images/v26/work-areas/visuals/vis-lib-26-2.png" />

<Note>
  You can select and open a visual in the visual gallery to make a copy of a visual if needed. See [Copy Visuals](/simba-embedded-analytics/docs/self-service-analytics/26.3/analyze-data/visuals/visual-add-dash#copy-visuals).
</Note>

## Search Field

Use the search field to filter the visuals shown by visual Type, Name, Description, Data Source, or Author. For example, if you type a **C** in the search box, only visuals that include the letter *C* in the selected field searched (or all fields if All is selected) are shown in the working area. See [Search and Filter Lists](/simba-embedded-analytics/docs/self-service-analytics/26.3/get-started/welcome#search-and-filter-lists).

## Buttons

The buttons on the page allow easy access to saved visuals, as well as other visuals created by other users in your Self-Service Analytics environment. They also allow you to create a new visual and filter the visuals shown.

<table>
  <thead>
    <tr>
      <th>Button</th>
      <th>Description</th>
    </tr>
  </thead>

  <tbody>
    <tr>
      <td>All</td>
      <td>Removes any filters for the visual gallery and displays all visuals you can access within your Self-Service Analytics environment.</td>
    </tr>

    <tr>
      <td>
        <img src="https://mintcdn.com/insightsoftware/2cXq_sDOxrDVXUcv/simba-embedded-analytics/docs/self-service-analytics/26.3/images/buttons/dash-favorites.png?fit=max&auto=format&n=2cXq_sDOxrDVXUcv&q=85&s=3f42e7b5a7ec088f144961fc4e0b8168" alt="" width="32" height="32" noZoom style={{display: 'inline', verticalAlign: 'middle', width: '32px', height: '32px', margin: '0 2px'}} data-path="simba-embedded-analytics/docs/self-service-analytics/26.3/images/buttons/dash-favorites.png" />
      </td>

      <td>Displays only the visuals that you have marked as favorites.</td>
    </tr>

    <tr>
      <td>
        <img src="https://mintcdn.com/insightsoftware/2cXq_sDOxrDVXUcv/simba-embedded-analytics/docs/self-service-analytics/26.3/images/buttons/dash-myitems.png?fit=max&auto=format&n=2cXq_sDOxrDVXUcv&q=85&s=75cdbc10c3bd2b5d2e24e0f566314a74" alt="" width="32" height="32" noZoom style={{display: 'inline', verticalAlign: 'middle', width: '32px', height: '32px', margin: '0 2px'}} data-path="simba-embedded-analytics/docs/self-service-analytics/26.3/images/buttons/dash-myitems.png" />
      </td>

      <td>Displays only visuals that you created and saved. Visuals created and saved by other users are hidden.</td>
    </tr>

    <tr>
      <td>
        <img src="https://mintcdn.com/insightsoftware/2cXq_sDOxrDVXUcv/simba-embedded-analytics/docs/self-service-analytics/26.3/images/buttons/dash-shared.png?fit=max&auto=format&n=2cXq_sDOxrDVXUcv&q=85&s=acc922b30add9660f0e1a0c755601279" alt="" width="32" height="32" noZoom style={{display: 'inline', verticalAlign: 'middle', width: '32px', height: '32px', margin: '0 2px'}} data-path="simba-embedded-analytics/docs/self-service-analytics/26.3/images/buttons/dash-shared.png" />
      </td>

      <td>
        Displays only the visuals that other users shared with you.

        <br />

        See [Grant Permissions for a Visual](/simba-embedded-analytics/docs/self-service-analytics/26.3/analyze-data/visuals/visual-auth#grant-permissions-for-a-visual).
      </td>
    </tr>

    <tr>
      <td>
        <img src="https://mintcdn.com/insightsoftware/sLccJ1EJ28cO5lT_/simba-embedded-analytics/docs/self-service-analytics/26.3/images/icons/dashboard-embed.png?fit=max&auto=format&n=sLccJ1EJ28cO5lT_&q=85&s=64e9abef187115e782e94be2349f4b08" alt="" width="32" height="32" noZoom style={{display: 'inline', verticalAlign: 'middle', width: '32px', height: '32px', margin: '0 2px'}} data-path="simba-embedded-analytics/docs/self-service-analytics/26.3/images/icons/dashboard-embed.png" />
      </td>

      <td>
        Select to generate an embeddable visual link.

        <br />

        See [Generate a Visual Gallery HTML Snippet](/simba-embedded-analytics/docs/self-service-analytics/26.3/embed-and-extend/embed/dash-embed-gencode-dashboard#generate-a-visual-gallery-html-snippet).
      </td>
    </tr>

    <tr>
      <td>**Export Selected Items**</td>

      <td>
        Select to export multiple selected items.

        <br />

        See [Export Visual Gallery Visuals](#export-visual-gallery-visuals).
      </td>
    </tr>

    <tr>
      <td>**Import Visual**</td>

      <td>
        Select to import one or more visuals.

        <br />

        See [Import Visual Gallery Visuals](#import-visual-gallery-visuals).
      </td>
    </tr>

    <tr>
      <td>**Create Visual**</td>
      <td>Select to create a new visual. See [Create and Add Visuals to the Visual Gallery](/simba-embedded-analytics/docs/self-service-analytics/26.3/analyze-data/visuals/visual-add-dash#create-and-add-visuals-to-the-visual-gallery).</td>
    </tr>
  </tbody>
</table>

## The Visual Gallery List

Each column in the table is described below. Several of these columns can be used to sort the list: select the column header to sort first to last and again to sort last to first. You can search for items by the contents of several columns. See [Search and Filter Lists](/simba-embedded-analytics/docs/self-service-analytics/26.3/get-started/welcome#search-and-filter-lists).

<table>
  <thead>
    <tr>
      <th>Column</th>
      <th>Description</th>
    </tr>
  </thead>

  <tbody>
    <tr>
      <td>Select (not labeled)</td>
      <td>Select one or more items to perform bulk actions, such as export, for your resources.</td>
    </tr>

    <tr>
      <td>Fav</td>
      <td>Identifies favorite visuals using a star icon. If the star is colored (<img src="https://mintcdn.com/insightsoftware/1fCfZrK84x8KmAw8/simba-embedded-analytics/docs/self-service-analytics/26.3/images/icons/star-filled.png?fit=max&auto=format&n=1fCfZrK84x8KmAw8&q=85&s=2ee76d6f85fbd0c028cac5946b824b24" alt="" width="16" height="19" noZoom style={{display: 'inline', verticalAlign: 'middle', width: '16px', height: '19px', margin: '0 2px'}} data-path="simba-embedded-analytics/docs/self-service-analytics/26.3/images/icons/star-filled.png" />), the visual is a favorite. If the star is empty (<img src="https://mintcdn.com/insightsoftware/1fCfZrK84x8KmAw8/simba-embedded-analytics/docs/self-service-analytics/26.3/images/icons/star-open.png?fit=max&auto=format&n=1fCfZrK84x8KmAw8&q=85&s=7e48cb6585e2fe8ca8a2c41ec3d77e7c" alt="" width="16" height="17" noZoom style={{display: 'inline', verticalAlign: 'middle', width: '16px', height: '17px', margin: '0 2px'}} data-path="simba-embedded-analytics/docs/self-service-analytics/26.3/images/icons/star-open.png" />), the visual is not a favorite.</td>
    </tr>

    <tr>
      <td>Type</td>

      <td>
        An icon identifying the visual type (style) of the visual in the visual.

        <br />

        See [Self-Service Analytics Visual Metrics and Attributes Reference](/simba-embedded-analytics/docs/self-service-analytics/26.3/embed-and-extend/api/application-framework/getting-started-with-the-application-framework#self-service-analytics-visual-metrics-and-attributes-reference) to see all the possibilities.
      </td>
    </tr>

    <tr>
      <td>Name</td>

      <td>
        The name assigned to the visual. The visual name is not necessarily the same as the display name.

        <br />

        See [Configure Visual Names, Descriptions, and Properties](/simba-embedded-analytics/docs/self-service-analytics/26.3/analyze-data/visuals/visual-save) for more information about how visual names and display names are set.
      </td>
    </tr>

    <tr>
      <td>Description (not labeled)</td>
      <td>The description icon is visible if a description associated with a visual. You can search for a visual by the contents of this field.</td>
    </tr>

    <tr>
      <td>Tags</td>
      <td>Content tags applied to the visual. Select the filter icon to open a drop-down list and select tags to filter your list or to [narrow your search results](/simba-embedded-analytics/docs/self-service-analytics/26.3/get-started/welcome#filter-lists-and-search-results-using-tags). If several tags are associated with an item, hover over the ellipsis to see all tags for this resource.</td>
    </tr>

    <tr>
      <td>Data Source</td>
      <td>The name of the data source used by the visual. If a user does not have permission to view the data source, this field is blank.</td>
    </tr>

    <tr>
      <td>Author</td>
      <td>The name of the user who defined the visual.</td>
    </tr>

    <tr>
      <td>Modified Date</td>
      <td>The time stamp indicating when the visual was last modified.</td>
    </tr>

    <tr>
      <td>Permissions</td>
      <td>Assign and manage the permissions for a visual. Visible if you are logged in as a user with the **Administer Sources** [privilege](/simba-embedded-analytics/docs/self-service-analytics/26.3/administer/users/aaa-ov#group-privilege-reference), or as a user with the **Manage Source Permissions** privilege.</td>
    </tr>

    <tr>
      <td>Actions</td>

      <td>
        Delete a visual if you have delete permissions. Before you delete a visual, you must remove it from all the dashboards that use it.

        <br />

        See [Delete and Remove Visuals](/simba-embedded-analytics/docs/self-service-analytics/26.3/analyze-data/visuals/visual-save#delete-and-remove-visuals).
      </td>
    </tr>
  </tbody>
</table>

<h2 id="import-visual-gallery-visuals">
  Import Visual Gallery Visuals
</h2>

<Note>
  In this release, when your admin enables the Enhanced Experience user interface, you will see changes to workflows you may have used in previous releases.
</Note>

**Import one or more visuals**

1. Log in as a user with the **Manage Connections**, **Administer Sources**, **Administer Visuals** [privilege](/simba-embedded-analytics/docs/self-service-analytics/26.3/administer/users/aaa-ov#group-privilege-reference). If you are logged in as a tenant admin, verify you're in or switch to the appropriate tenant.

2. Select **Visual Gallery** from the main menu. The visual gallery work area opens.

3. Select **Import Visual**. The Import Visuals dialog opens.

4. Browse to and choose the `json` file for the visuals you want to import, then select **Open**.

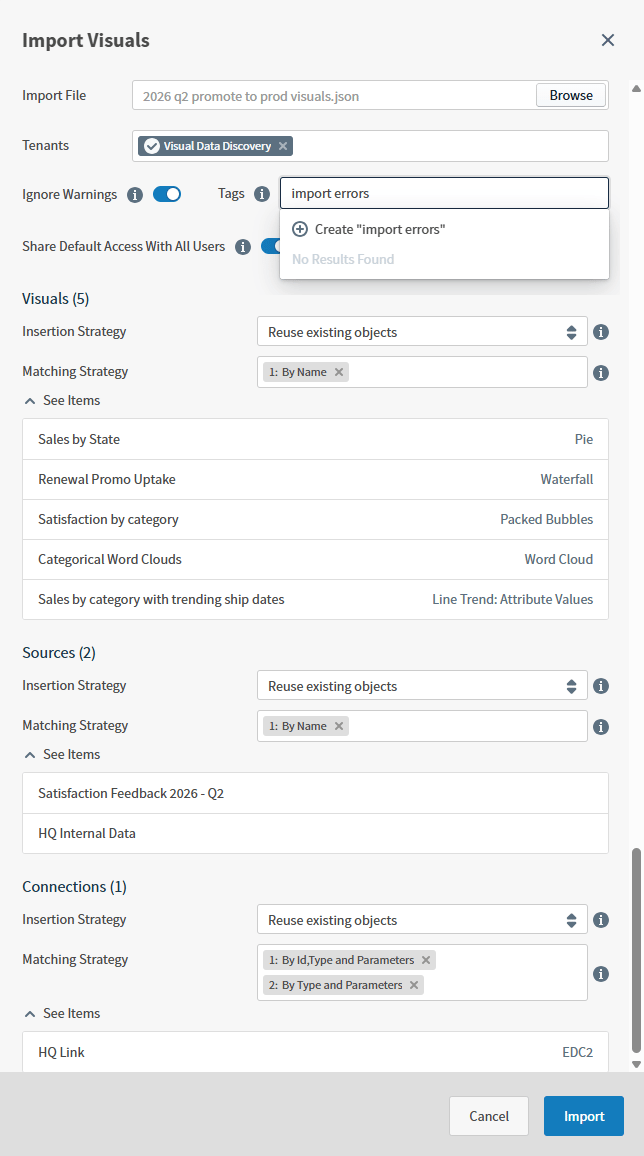
   The Import Visuals dialog populates with information about the objects that make up your visuals and the settings you can use to define how your software inserts each object.

   <img src="https://mintcdn.com/insightsoftware/b9ogX_L4Mqut_Uxb/simba-embedded-analytics/docs/self-service-analytics/26.3/images/v26/work-areas/visuals/imp-vis-26-2.png?fit=max&auto=format&n=b9ogX_L4Mqut_Uxb&q=85&s=430e103ae28fbbe5bf0069430218f110" alt="Use this work are to define what JSON file to import, for which tenants, using what insertion strategies, matching strategies, tags, and access rights" width="644" height="1156" data-path="simba-embedded-analytics/docs/self-service-analytics/26.3/images/v26/work-areas/visuals/imp-vis-26-2.png" />

5. Add and remove tenants by selecting the **Tenants** field. Add or remove them from the list or field.

   <Note>
     Only system admins or members of the Content Distributors group see the Tenants field. If this field is not shown, the content is imported into the tenant you are currently working in.
   </Note>

6. Optionally, enable or disable **Ignore Warnings**.

   When you enable **Ignore Warnings**, a Tags field is added to the Import work area. Add or create tags to apply to objects that do not import cleanly.

   * If errors occur during import, your software adds the tags you select to the affected objects.
   * Use the tags to find visuals or sources you need to fix.

   <Note>
     When you enable Ignore Warnings, items that can be imported with warnings are imported and tagged. Use these tags to find and fix the warnings in tagged objects. When disabled, no objects are imported, and errors are returned to aid in troubleshooting.
   </Note>

7. Select an **Insertion Strategy** for each group of objects.

   * **Always create objects**: Select to create an object every time, even if an existing object exists with the same name or unique ID. The object is created, appended with a date and time to the name, and assigned a unique ID.
   * **Reuse existing objects**: Select to create an object if no object with the same name exists. If an object with the same name or unique ID exists, the original object is reused.
   * **Update existing objects**: Select to update (overwrite) an existing object with the same name or unique ID. If an object with the same name does not exist, an object is created.

8. Use the default **Matching Strategy** or select the appropriate strategies for your sources in the order you want the strategies to be processed. See [Matching Strategies](#matching-strategies) .

9. Enable **Share Default Access With All Users** to immediately give your users access to the content you import.

10. After you have confirmed your choices, select **Import**. The visuals are imported and a success message is returned if objects import successfully or with accepted warnings. Any items imported with warnings have your selected tags applied.

Visuals with a unique name are imported with that name. If the name is not unique, the newly imported visual is imported and the name appended with a date and time.

<Warning>
  Trying to import a visual that uses the same source name as an existing source but uses different connection details or credentials may cause issues. Change the name of the source before you export it from one instance and import it into another.
</Warning>

See [Export Visual Gallery Visuals](#export-visual-gallery-visuals).

<h4 id="matching-strategies">
  Matching Strategies
</h4>

When you import objects into Self-Service Analytics, combine these matching strategies with your selected insertion strategies to meet your organization's needs. The strategies are applied in the order you select. When you create new objects, matching strategies are not used.

##### Visuals

| Strategy     | Notes                                                          |
| ------------ | -------------------------------------------------------------- |
| By Name      | The default strategy used if no other strategies are selected. |
| By Origin ID |                                                                |

##### Sources

| Strategy     | Notes                                                          |
| ------------ | -------------------------------------------------------------- |
| By Name      | The default strategy used if no other strategies are selected. |
| By Origin ID |                                                                |

##### Connections

| Strategy                    | Notes                                                                                                                     |
| --------------------------- | ------------------------------------------------------------------------------------------------------------------------- |
| By Id, Type, and Parameters | A default strategy used if no other strategies are selected. Used with **By Type and Parameters** if it's not deselected. |
| By Type and Parameters      | A default strategy used if no other strategies are selected. Used with **By Id, Type, and Parameters**.                   |
| By Name                     |                                                                                                                           |
| By Name and Type            |                                                                                                                           |
| By Origin ID                |                                                                                                                           |
| By Type and Parameter Keys  |                                                                                                                           |

<h2 id="export-visual-gallery-visuals">
  Export Visual Gallery Visuals
</h2>

**Export one or more visuals**

1. Log in as a user with the [**Export Visuals** privilege](/simba-embedded-analytics/docs/self-service-analytics/26.3/administer/users/aaa-ov#group-privilege-reference). Open the Visual Gallery to view a list of the available visuals.
2. Select to export one or more visuals by selecting the checkbox for each visual to export. The **Export Selected Items** button becomes active.
3. Select **Export Selected Items**. You browser downloads the selected items in JSON format, placing them in the location you select or the default location for your browser downloads.

Visual gallery visuals exported using the export API can include source cache settings for the data and statistics caches in the payload.

API documentation is provided in your environment at this link: `https://<Self-Service Analytics-URL>/composer/swagger-ui.html`.