> ## Documentation Index
> Fetch the complete documentation index at: https://insightsoftware.mintlify.site/llms.txt
> Use this file to discover all available pages before exploring further.

# Manage Visuals

> You can create visuals on a dashboard.

Visuals take data from your data sources so you can present information in an easy to view, adjust, and update format.

When you create visuals that are used in multiple dashboards, stored and shared among Self-Service Analytics users, they are stored in the Visual Gallery. These visuals can be converted into local visuals, unique to that dashboard, allowing you to make changes that do not affect the original shared visual.

Local visuals are visuals you create that are unique to a single dashboard. Experiment with data presentation and filtering techniques, or make local copies of existing visual gallery visuals to present alternatives without impacting visual gallery visuals.

<h2 id="create-and-add-visuals-to-the-visual-gallery">
  Create and Add Visuals to the Visual Gallery
</h2>

When you access the visual gallery, it displays a list of all the visuals you and other content authors have created and can use, based on your access permissions. You can add visuals directly to this gallery, or convert a local visual to add it to the visual gallery to make it available to others for use.

Users can also create visuals with the assistance of AI. See [Generate Visuals](/simba-embedded-analytics/docs/self-service-analytics/26.3/analyze-data/visuals/generate-visuals).

<Note>
  In this release, when your admin enables the Enhanced Experience user interface, you will see changes to workflows you may have used in previous releases.
</Note>

**Create a visual in the Visual Gallery**

1. Log in as a user with the **Create Visuals** or **Administer Visuals** [group privilege](/simba-embedded-analytics/docs/self-service-analytics/26.3/administer/users/aaa-ov#group-privilege-reference).

2. Select **Visual Gallery** from the main menu. The Visuals library appears.

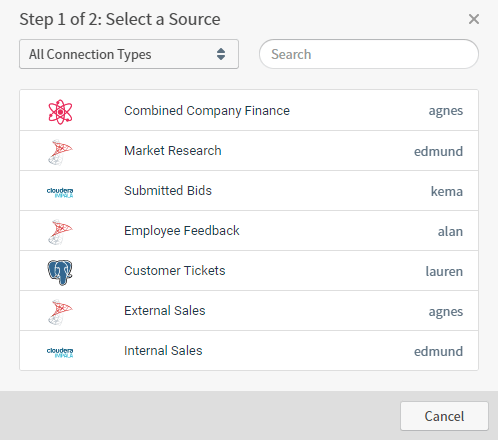
3. Select **Add Visual** to add a new visual. The Select a Source dialog appears.

   <img src="https://mintcdn.com/insightsoftware/cQU1Auv4yvPMjcip/simba-embedded-analytics/docs/self-service-analytics/26.3/images/visuals/vg-visualds-710.png?fit=max&auto=format&n=cQU1Auv4yvPMjcip&q=85&s=a39026004d07971aa0b1618188236e67" alt="" width="498" height="440" data-path="simba-embedded-analytics/docs/self-service-analytics/26.3/images/visuals/vg-visualds-710.png" />

4. Select a data source on the **Step 1 of 2: Select a Source** dialog. The Select a **Visual** Type dialog appears.
   <img src="https://mintcdn.com/insightsoftware/cQU1Auv4yvPMjcip/simba-embedded-analytics/docs/self-service-analytics/26.3/images/visuals/vg-visualstyle-710.png?fit=max&auto=format&n=cQU1Auv4yvPMjcip&q=85&s=99062c6b939b8355320486b8180017ee" alt="" width="498" height="653" data-path="simba-embedded-analytics/docs/self-service-analytics/26.3/images/visuals/vg-visualstyle-710.png" />

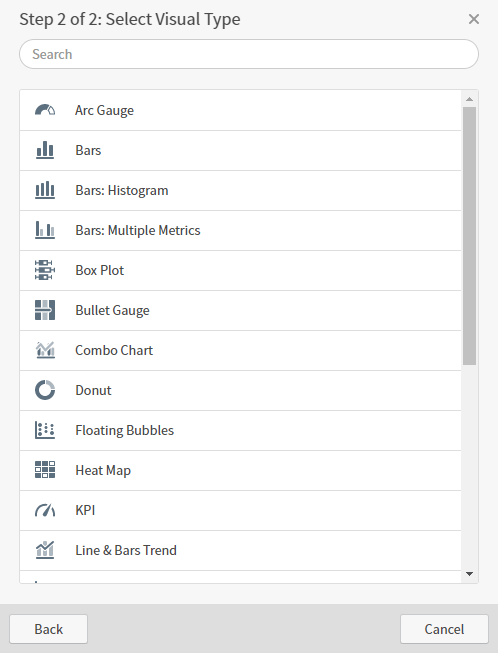
5. Select a visual on the **Step 2 of 2: Select** **Visual** **Type** dialog. For example, select **Bars**. The visual is created.

   <Note>
     If you [create a table visual](/simba-embedded-analytics/docs/self-service-analytics/26.3/analyze-data/visuals/rdt), you are prompted to select one or more columns to include. Select your columns, then select **Create Visual** to generate the visual.
   </Note>

6. Optionally, select the default visual name (**Untitled Visual**) and change it. See [Configure Visual Names, Descriptions, and Properties](/simba-embedded-analytics/docs/self-service-analytics/26.3/analyze-data/visuals/visual-save).

   The minimum length of visual names and display names is one character; the maximum length is 255 characters. Names can start with and contain numbers, special characters, and uppercase and lowercase characters. Names can contain spaces, but cannot start with a space. Names can not be empty, contain only spaces, or include leading or trailing spaces.

   Visual name uniqueness is enforced. When you attempt to save a visual in the Visual Gallery with the same name as another visual, an error message appears and the visual is not saved.

7. You can also add a **Visual Description** for this visual. This content in searchable in the visual gallery, and appears in the info panel of the visual both in the gallery and dashboards.

8. Make any other changes to the visual that you need.

9. Save the visual.

**Add a local visual to the Visual Gallery**

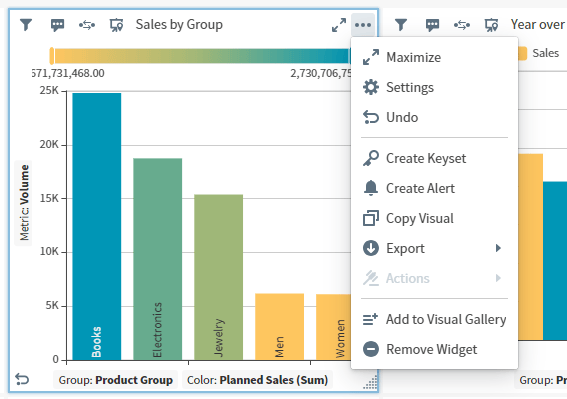
1. Create or select a local visual in your dashboard, then select <img src="https://mintcdn.com/insightsoftware/sLccJ1EJ28cO5lT_/simba-embedded-analytics/docs/self-service-analytics/26.3/images/icons/more-menu.png?fit=max&auto=format&n=sLccJ1EJ28cO5lT_&q=85&s=1471c7a569a7e100cd7fa4083b04551a" alt="Selet the three dots icon to open a show more menu or take actions for the named column" width="21" height="12" noZoom style={{display: 'inline', verticalAlign: 'middle', width: '21px', height: '12px', margin: '0 2px'}} data-path="simba-embedded-analytics/docs/self-service-analytics/26.3/images/icons/more-menu.png" /> to view available visual options.

   <img src="https://mintcdn.com/insightsoftware/cQU1Auv4yvPMjcip/simba-embedded-analytics/docs/self-service-analytics/26.3/images/visuals/local-visual-cvt-vg-23-2.png?fit=max&auto=format&n=cQU1Auv4yvPMjcip&q=85&s=6cc6794d99eab835cdd3fce890153f32" alt="Select an action to take for a local visual" width="567" height="399" data-path="simba-embedded-analytics/docs/self-service-analytics/26.3/images/visuals/local-visual-cvt-vg-23-2.png" />

2. Select **Add to Visual Gallery**. A Save Options dialog opens.

   <img src="https://mintcdn.com/insightsoftware/cQU1Auv4yvPMjcip/simba-embedded-analytics/docs/self-service-analytics/26.3/images/visuals/local-visual-save-23-2.png?fit=max&auto=format&n=cQU1Auv4yvPMjcip&q=85&s=3f62df7f9174d3fd19ab7383be6e44ad" alt="" width="500" height="283" data-path="simba-embedded-analytics/docs/self-service-analytics/26.3/images/visuals/local-visual-save-23-2.png" />

3. Enter a **Visual Name** and optionally, a **Visual Description**.

4. Leave **Replace the visual on the dashboard** option selected to add the visual to the gallery and replace the local visual on your dashboard. Deselect to add the visual to the gallery and leave the local visual in place.

   If the saved visual name exists in the visual gallery, your visual saved with a number in parentheses `(<n>)` at the end of the name to make it unique to the gallery.

5. Save the dashboard to save your changes. If you change the visual, save the visual to retain your visual changes.

   <img src="https://mintcdn.com/insightsoftware/cQU1Auv4yvPMjcip/simba-embedded-analytics/docs/self-service-analytics/26.3/images/visuals/vg-visual-23-2.png?fit=max&auto=format&n=cQU1Auv4yvPMjcip&q=85&s=cfeab13e6e2d9cc2aa56998368236724" alt="" width="549" height="482" data-path="simba-embedded-analytics/docs/self-service-analytics/26.3/images/visuals/vg-visual-23-2.png" />

   <Note>
     If you deselect **Replace the visual on the dashboard**, your visual is added to the visual gallery, and a copy (the local visual) remains on your dashboard.
   </Note>

## Add Visuals to a Dashboard

When you [create](/simba-embedded-analytics/docs/self-service-analytics/26.3/analyze-data/dashboards/dash-manage#create-dashboards) or edit a dashboard, you can create and add a new local visual, or add an existing visual from the [Visual Gallery](/simba-embedded-analytics/docs/self-service-analytics/26.3/analyze-data/visuals/visual-gallery). Local visuals use the dashboard's permission set. See [Add Local Visuals to a Dashboard](#add-local-visuals-to-a-dashboard) and [Add Existing Visuals to a Dashboard](#add-existing-visuals-to-a-dashboard).

<Note>
  Local visuals exist only on the dashboard on which they were created. Convert to a Visual Gallery visual and add to the Visual Gallery at any time. Visual gallery visuals can be converted to a local visual at any time. See [Convert Visual Gallery Visuals and Local Visuals](#convert-visual-gallery-visuals-and-local-visuals).
</Note>

**Add a local visual to a dashboard**

1. [Create](/simba-embedded-analytics/docs/self-service-analytics/26.3/analyze-data/dashboards/dash-manage#create-dashboards) or [edit](/simba-embedded-analytics/docs/self-service-analytics/26.3/analyze-data/dashboards/dash-manage#edit-a-dashboard) a dashboard.

   * Users with the [**Administer Dashboards** privilege](/simba-embedded-analytics/docs/self-service-analytics/26.3/administer/users/aaa-ov#group-privilege-reference) can create dashboards and add new local visuals to dashboards.
   * Users with Owner and Editor access levels to a dashboard can add new local visuals to the dashboard.

2. Select the Add Visual icon from the [dashboard icon bar](/simba-embedded-analytics/docs/self-service-analytics/26.3/analyze-data/dashboards/dash-layout#use-the-dashboard-icons). A drop-down menu appears with two options: Add New Visual and Add Existing Visual.

3. Select **Add New Visual** to add a local visual to the dashboard. The Select a Source dialog appears.

4. Select a data source on the **Step 1 of 2: Select a Source** dialog. The Select a Visual Type dialog appears.

5. Select a visual type on the **Step 2 of 2: Select Visual Type** dialog. The visual is created and added to the dashboard.

   <Note>
     If you [create a table visual](/simba-embedded-analytics/docs/self-service-analytics/26.3/analyze-data/visuals/rdt), you are prompted to select one or more columns to include. Select your columns, then select **Create Visual** to generate the visual.
   </Note>

   <Warning>
     Local visuals are unique to the dashboard, and are deleted when the dashboard is deleted. Changes to a local visual do not affect other dashboards.
   </Warning>

6. Optionally, click on the display name and change it. See [Configure Visual Names, Descriptions, and Properties](/simba-embedded-analytics/docs/self-service-analytics/26.3/analyze-data/visuals/visual-save).

   The minimum length of visual names and display names is one character; the maximum length is 255 characters. Names can start with and contain numbers, special characters, and uppercase and lowercase characters. Names can contain spaces, but cannot start with a space. Names can not be empty, contain only spaces, or include leading or trailing spaces.

   If you try to save a local visual in a dashboard that has the same name as another visual, the visual is saved with a number in parentheses `(<n>)` at the end of the name to make it unique to the dashboard.

7. [Modify](/simba-embedded-analytics/docs/self-service-analytics/26.3/analyze-data/visuals/visual-setup#edit-visuals) and make any other changes to the visual you need.

8. [Save](/simba-embedded-analytics/docs/self-service-analytics/26.3/analyze-data/dashboards/dash-manage#save-a-dashboard) your dashboard. If you close the dashboard without saving it, the local visual is not saved.

**Add an existing visual to a dashboard from the Visual Gallery**

1. [Create](/simba-embedded-analytics/docs/self-service-analytics/26.3/analyze-data/dashboards/dash-manage#create-dashboards) or [edit](/simba-embedded-analytics/docs/self-service-analytics/26.3/analyze-data/dashboards/dash-manage#edit-a-dashboard) a dashboard.

   * Users with the [**Administer Dashboards** privilege](/simba-embedded-analytics/docs/self-service-analytics/26.3/administer/users/aaa-ov#group-privilege-reference) can create dashboards and add visuals to dashboards.
   * Users with Owner and Editor access levels to a dashboard can add visuals they can access to the dashboard.

2. Select Add Visual icon <img src="https://mintcdn.com/insightsoftware/sLccJ1EJ28cO5lT_/simba-embedded-analytics/docs/self-service-analytics/26.3/images/icons/add.png?fit=max&auto=format&n=sLccJ1EJ28cO5lT_&q=85&s=9a24b95d9385f23950764407d5e9111a" alt="Add Visual icon" width="16" height="16" noZoom style={{display: 'inline', verticalAlign: 'middle', width: '16px', height: '16px', margin: '0 2px'}} data-path="simba-embedded-analytics/docs/self-service-analytics/26.3/images/icons/add.png" /> from the [dashboard icon bar](/simba-embedded-analytics/docs/self-service-analytics/26.3/analyze-data/dashboards/dash-layout#use-the-dashboard-icons). A drop-down menu appears with two options: Add New Visual and Add Existing Visual.

3. Select **Add Existing Visual** to add an existing visual to the dashboard. The Select a Visual dialog appears.

4. Select a visual from the Visual Gallery in the **Select a Visual** work area. The visual is added to the dashboard in a widget.

5. [Modify](/simba-embedded-analytics/docs/self-service-analytics/26.3/analyze-data/visuals/visual-setup#edit-visuals) the visual as needed.

6. [Save](/simba-embedded-analytics/docs/self-service-analytics/26.3/analyze-data/dashboards/dash-manage#save-a-dashboard) your dashboard.

<h2 id="add-existing-visuals-to-a-dashboard">
  Add Existing Visuals to a Dashboard
</h2>

When you create or edit a dashboard, you can add an existing visual from the [Visual Gallery](/simba-embedded-analytics/docs/self-service-analytics/26.3/analyze-data/visuals/visual-gallery). After you have added an existing visual, you can [convert it to a local visual](#convert-visual-gallery-visuals-and-local-visuals), making a copy unique to the dashboard that you can manipulate without affecting other dashboards.

**Add an existing visual to a dashboard from the Visual Gallery**

1. [Create](/simba-embedded-analytics/docs/self-service-analytics/26.3/analyze-data/dashboards/dash-manage#create-dashboards) or [edit](/simba-embedded-analytics/docs/self-service-analytics/26.3/analyze-data/dashboards/dash-manage#edit-a-dashboard) a dashboard.

   * Users with the [**Administer Dashboards** privilege](/simba-embedded-analytics/docs/self-service-analytics/26.3/administer/users/aaa-ov#group-privilege-reference) can create dashboards and add visuals to dashboards.
   * Users with Owner and Editor access levels to a dashboard can add visuals they can access to the dashboard.

2. Select Add Visual icon <img src="https://mintcdn.com/insightsoftware/sLccJ1EJ28cO5lT_/simba-embedded-analytics/docs/self-service-analytics/26.3/images/icons/add.png?fit=max&auto=format&n=sLccJ1EJ28cO5lT_&q=85&s=9a24b95d9385f23950764407d5e9111a" alt="Add Visual icon" width="16" height="16" noZoom style={{display: 'inline', verticalAlign: 'middle', width: '16px', height: '16px', margin: '0 2px'}} data-path="simba-embedded-analytics/docs/self-service-analytics/26.3/images/icons/add.png" /> from the [dashboard icon bar](/simba-embedded-analytics/docs/self-service-analytics/26.3/analyze-data/dashboards/dash-layout#use-the-dashboard-icons). A drop-down menu appears with two options: Add New Visual and Add Existing Visual.

3. Select **Add Existing Visual** to add an existing visual to the dashboard. The Select a Visual dialog appears.

4. Select a visual from the Visual Gallery in the **Select a Visual** work area. The visual is added to the dashboard in a widget.

5. [Modify](/simba-embedded-analytics/docs/self-service-analytics/26.3/analyze-data/visuals/visual-setup#edit-visuals) the visual as needed.

6. [Save](/simba-embedded-analytics/docs/self-service-analytics/26.3/analyze-data/dashboards/dash-manage#save-a-dashboard) your dashboard.

<h2 id="add-local-visuals-to-a-dashboard">
  Add Local Visuals to a Dashboard
</h2>

Local visuals, using the permission set of the dashboard, allow your self service users to create visuals they need for a specific dashboard or scenario. If needed, they can be added to the Visual Gallery and shared.

To create local visuals, you need to be a user with Owner or Editor access to a dashboard, or a user with the [**Administer Dashboards** privilege](/simba-embedded-analytics/docs/self-service-analytics/26.3/administer/users/aaa-ov#group-privilege-reference).

<Note>
  Local visuals exist only on the dashboard on which they were created. Convert to a Visual Gallery visual and add to the Visual Gallery at any time. Visual gallery visuals can be converted to a local visual at any time. See [Convert Visual Gallery Visuals and Local Visuals](#convert-visual-gallery-visuals-and-local-visuals).
</Note>

**Add a local visual to a dashboard**

1. [Create](/simba-embedded-analytics/docs/self-service-analytics/26.3/analyze-data/dashboards/dash-manage#create-dashboards) or [edit](/simba-embedded-analytics/docs/self-service-analytics/26.3/analyze-data/dashboards/dash-manage#edit-a-dashboard) a dashboard.

   * Users with the [**Administer Dashboards** privilege](/simba-embedded-analytics/docs/self-service-analytics/26.3/administer/users/aaa-ov#group-privilege-reference) can create dashboards and add new local visuals to dashboards.
   * Users with Owner and Editor access levels to a dashboard can add new local visuals to the dashboard.

2. Select the Add Visual icon from the [dashboard icon bar](/simba-embedded-analytics/docs/self-service-analytics/26.3/analyze-data/dashboards/dash-layout#use-the-dashboard-icons). A drop-down menu appears with two options: Add New Visual and Add Existing Visual.

3. Select **Add New Visual** to add a local visual to the dashboard. The Select a Source dialog appears.

4. Select a data source on the **Step 1 of 2: Select a Source** dialog. The Select a Visual Type dialog appears.

5. Select a visual type on the **Step 2 of 2: Select Visual Type** dialog. The visual is created and added to the dashboard.

   <Note>
     If you [create a table visual](/simba-embedded-analytics/docs/self-service-analytics/26.3/analyze-data/visuals/rdt), you are prompted to select one or more columns to include. Select your columns, then select **Create Visual** to generate the visual.
   </Note>

   <Warning>
     Local visuals are unique to the dashboard, and are deleted when the dashboard is deleted. Changes to a local visual do not affect other dashboards.
   </Warning>

6. Optionally, click on the display name and change it. See [Configure Visual Names, Descriptions, and Properties](/simba-embedded-analytics/docs/self-service-analytics/26.3/analyze-data/visuals/visual-save).

   The minimum length of visual names and display names is one character; the maximum length is 255 characters. Names can start with and contain numbers, special characters, and uppercase and lowercase characters. Names can contain spaces, but cannot start with a space. Names can not be empty, contain only spaces, or include leading or trailing spaces.

   If you try to save a local visual in a dashboard that has the same name as another visual, the visual is saved with a number in parentheses `(<n>)` at the end of the name to make it unique to the dashboard.

7. [Modify](/simba-embedded-analytics/docs/self-service-analytics/26.3/analyze-data/visuals/visual-setup#edit-visuals) and make any other changes to the visual you need.

8. [Save](/simba-embedded-analytics/docs/self-service-analytics/26.3/analyze-data/dashboards/dash-manage#save-a-dashboard) your dashboard. If you close the dashboard without saving it, the local visual is not saved.

Convert a local visual to a visual gallery visual to share it with other users. See [Convert Visual Gallery Visuals and Local Visuals](#convert-visual-gallery-visuals-and-local-visuals).

<h2 id="convert-visual-gallery-visuals-and-local-visuals">
  Convert Visual Gallery Visuals and Local Visuals
</h2>

You can convert a visual from the visual gallery into a local visual, unique to that dashboard, and make changes to the local visual without affecting the data of primary visual you started from. As part of the conversion process, the interactivity settings for the visual are set to Self-Service Analytics defaults.

<Note>
  To create local visuals, you need to be a user with Owner or Editor access to a dashboard, or a user with the [**Administer Dashboards** privilege](/simba-embedded-analytics/docs/self-service-analytics/26.3/administer/users/aaa-ov#group-privilege-reference).
</Note>

**Convert a visual gallery visual to a local visual**

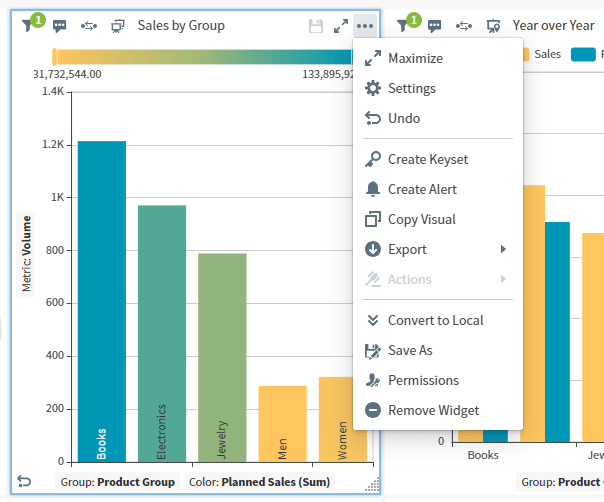
1. Add a visual from the visual gallery to your dashboard, then select <img src="https://mintcdn.com/insightsoftware/sLccJ1EJ28cO5lT_/simba-embedded-analytics/docs/self-service-analytics/26.3/images/icons/more-menu.png?fit=max&auto=format&n=sLccJ1EJ28cO5lT_&q=85&s=1471c7a569a7e100cd7fa4083b04551a" alt="Selet the three dots icon to open a show more menu or take actions for the named column" width="21" height="12" noZoom style={{display: 'inline', verticalAlign: 'middle', width: '21px', height: '12px', margin: '0 2px'}} data-path="simba-embedded-analytics/docs/self-service-analytics/26.3/images/icons/more-menu.png" /> to view available visual options.

   <img src="https://mintcdn.com/insightsoftware/cQU1Auv4yvPMjcip/simba-embedded-analytics/docs/self-service-analytics/26.3/images/visuals/vg-visual-cvt-loc-23-2.png?fit=max&auto=format&n=cQU1Auv4yvPMjcip&q=85&s=f4af6d049447c1c4a523b5394186e830" alt="Select an action to take for a visual gallery visual" width="604" height="502" data-path="simba-embedded-analytics/docs/self-service-analytics/26.3/images/visuals/vg-visual-cvt-loc-23-2.png" />

2. Select **Convert to Local**. Self-Service Analytics adds a copy of the saved visual from the visual gallery to the dashboard as a local visual.

3. [Save](/simba-embedded-analytics/docs/self-service-analytics/26.3/analyze-data/dashboards/dash-manage#save-a-dashboard) the dashboard to save your changes.

   <img src="https://mintcdn.com/insightsoftware/cQU1Auv4yvPMjcip/simba-embedded-analytics/docs/self-service-analytics/26.3/images/visuals/vg-visual-cvt-loc-after-23-2.png?fit=max&auto=format&n=cQU1Auv4yvPMjcip&q=85&s=7672725e77e438b016b7f0d538e9985a" alt="select and make changes to local visuals" width="566" height="402" data-path="simba-embedded-analytics/docs/self-service-analytics/26.3/images/visuals/vg-visual-cvt-loc-after-23-2.png" />

   <Note>
     If you add the visual gallery visual back to the dashboard, the visual name is incremented on the dashboard to differentiate it from the local visual of the same name.
   </Note>

**Convert a local visual to a visual gallery visual**

1. Create or select a local visual in your dashboard, then select <img src="https://mintcdn.com/insightsoftware/sLccJ1EJ28cO5lT_/simba-embedded-analytics/docs/self-service-analytics/26.3/images/icons/more-menu.png?fit=max&auto=format&n=sLccJ1EJ28cO5lT_&q=85&s=1471c7a569a7e100cd7fa4083b04551a" alt="Selet the three dots icon to open a show more menu or take actions for the named column" width="21" height="12" noZoom style={{display: 'inline', verticalAlign: 'middle', width: '21px', height: '12px', margin: '0 2px'}} data-path="simba-embedded-analytics/docs/self-service-analytics/26.3/images/icons/more-menu.png" /> to view available visual options.

   <img src="https://mintcdn.com/insightsoftware/cQU1Auv4yvPMjcip/simba-embedded-analytics/docs/self-service-analytics/26.3/images/visuals/local-visual-cvt-vg-23-2.png?fit=max&auto=format&n=cQU1Auv4yvPMjcip&q=85&s=6cc6794d99eab835cdd3fce890153f32" alt="Select an action to take for a local visual" width="567" height="399" data-path="simba-embedded-analytics/docs/self-service-analytics/26.3/images/visuals/local-visual-cvt-vg-23-2.png" />

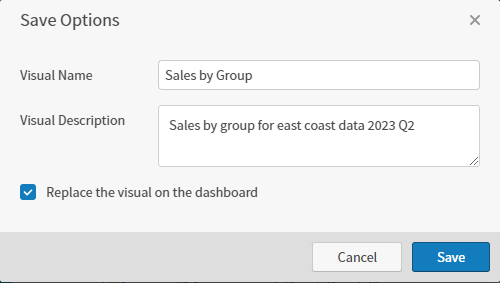
2. Select **Add to Visual Gallery**. A Save Options dialog opens.
   <img src="https://mintcdn.com/insightsoftware/cQU1Auv4yvPMjcip/simba-embedded-analytics/docs/self-service-analytics/26.3/images/visuals/local-visual-save-23-2.png?fit=max&auto=format&n=cQU1Auv4yvPMjcip&q=85&s=3f62df7f9174d3fd19ab7383be6e44ad" alt="" width="500" height="283" data-path="simba-embedded-analytics/docs/self-service-analytics/26.3/images/visuals/local-visual-save-23-2.png" />

3. Enter a **Visual Name** and optionally, a **Visual Description**.

4. Leave **Replace the visual on the dashboard** option selected to add the visual to the gallery and replace the local visual on your dashboard. Deselect to add the visual to the gallery and leave the local visual in place.

   If the saved visual name exists in the visual gallery, your visual saved with a number in parentheses `(<n>)` at the end of the name to make it unique to the gallery.

5. Save the dashboard to save your changes. If you change the visual, save the visual to retain your visual changes.

   <img src="https://mintcdn.com/insightsoftware/cQU1Auv4yvPMjcip/simba-embedded-analytics/docs/self-service-analytics/26.3/images/visuals/vg-visual-23-2.png?fit=max&auto=format&n=cQU1Auv4yvPMjcip&q=85&s=cfeab13e6e2d9cc2aa56998368236724" alt="" width="549" height="482" data-path="simba-embedded-analytics/docs/self-service-analytics/26.3/images/visuals/vg-visual-23-2.png" />

   <Note>
     If you deselect **Replace the visual on the dashboard**, your visual is added to the visual gallery, and a copy (the local visual) remains on your dashboard.
   </Note>

<h2 id="copy-visuals">
  Copy Visuals
</h2>

Make a copy of visuals in your dashboard to try alternate visualization scenarios by adding a copy of a local or shared visual gallery visual. You can also add a copy of a shared visual to the visual gallery from the dashboard or in the visual gallery to share with other users.

To control whether a visual can be copied, use the interactivity sidebar. See [Control How Users Interact With a Visual](/simba-embedded-analytics/docs/self-service-analytics/26.3/analyze-data/visuals/visual-interactivity).

<table>
  <thead>
    <tr>
      <th>Action</th>
      <th>Description</th>
    </tr>
  </thead>

  <tbody>
    <tr>
      <td>Copy a local visual <img src="https://mintcdn.com/insightsoftware/1fCfZrK84x8KmAw8/simba-embedded-analytics/docs/self-service-analytics/26.3/images/icons/visual-local.png?fit=max&auto=format&n=1fCfZrK84x8KmAw8&q=85&s=4639cd098713ec6fab97be31326c0efd" alt="" width="20" height="20" noZoom style={{display: 'inline', verticalAlign: 'middle', width: '20px', height: '20px', margin: '0 2px'}} data-path="simba-embedded-analytics/docs/self-service-analytics/26.3/images/icons/visual-local.png" /></td>
      <td>Select <img src="https://mintcdn.com/insightsoftware/sLccJ1EJ28cO5lT_/simba-embedded-analytics/docs/self-service-analytics/26.3/images/icons/copy-visual.png?fit=max&auto=format&n=sLccJ1EJ28cO5lT_&q=85&s=7e8e3dc29cfb6991ffb949909304e2af" alt="" width="20" height="21" noZoom style={{display: 'inline', verticalAlign: 'middle', width: '20px', height: '21px', margin: '0 2px'}} data-path="simba-embedded-analytics/docs/self-service-analytics/26.3/images/icons/copy-visual.png" /> **Copy Visual** from the [visual drop-down menu](/simba-embedded-analytics/docs/self-service-analytics/26.3/analyze-data/visuals/visual-setup#use-the-visual-drop-down-menu). Self-Service Analytics duplicates the visual on the dashboard as another local visual. The display name is incremented by 1.</td>
    </tr>

    <tr>
      <td>Copy a visual gallery visual <img src="https://mintcdn.com/insightsoftware/1fCfZrK84x8KmAw8/simba-embedded-analytics/docs/self-service-analytics/26.3/images/icons/visual-shared.png?fit=max&auto=format&n=1fCfZrK84x8KmAw8&q=85&s=8f2882bddad018bea849230503ec30ce" alt="" width="20" height="20" noZoom style={{display: 'inline', verticalAlign: 'middle', width: '20px', height: '20px', margin: '0 2px'}} data-path="simba-embedded-analytics/docs/self-service-analytics/26.3/images/icons/visual-shared.png" /></td>
      <td>Select <img src="https://mintcdn.com/insightsoftware/sLccJ1EJ28cO5lT_/simba-embedded-analytics/docs/self-service-analytics/26.3/images/icons/copy-visual.png?fit=max&auto=format&n=sLccJ1EJ28cO5lT_&q=85&s=7e8e3dc29cfb6991ffb949909304e2af" alt="" width="20" height="21" noZoom style={{display: 'inline', verticalAlign: 'middle', width: '20px', height: '21px', margin: '0 2px'}} data-path="simba-embedded-analytics/docs/self-service-analytics/26.3/images/icons/copy-visual.png" /> **Copy Visual** from the [visual drop-down menu](/simba-embedded-analytics/docs/self-service-analytics/26.3/analyze-data/visuals/visual-setup#use-the-visual-drop-down-menu). Self-Service Analytics duplicates the visual on the dashboard as a local visual. The display name is incremented by 1.</td>
    </tr>

    <tr>
      <td>Copy a visual gallery visual <img src="https://mintcdn.com/insightsoftware/1fCfZrK84x8KmAw8/simba-embedded-analytics/docs/self-service-analytics/26.3/images/icons/visual-shared.png?fit=max&auto=format&n=1fCfZrK84x8KmAw8&q=85&s=8f2882bddad018bea849230503ec30ce" alt="" width="20" height="20" noZoom style={{display: 'inline', verticalAlign: 'middle', width: '20px', height: '20px', margin: '0 2px'}} data-path="simba-embedded-analytics/docs/self-service-analytics/26.3/images/icons/visual-shared.png" /></td>

      <td>
        Select <img src="https://mintcdn.com/insightsoftware/2cXq_sDOxrDVXUcv/simba-embedded-analytics/docs/self-service-analytics/26.3/images/dashboards/dash-save-as.png?fit=max&auto=format&n=2cXq_sDOxrDVXUcv&q=85&s=0a1f29aed30da7ee353c14aac6c1c591" alt="" width="20" height="22" noZoom style={{display: 'inline', verticalAlign: 'middle', width: '20px', height: '22px', margin: '0 2px'}} data-path="simba-embedded-analytics/docs/self-service-analytics/26.3/images/dashboards/dash-save-as.png" /> **Save As** from the [visual drop-down menu](/simba-embedded-analytics/docs/self-service-analytics/26.3/analyze-data/visuals/visual-setup#use-the-visual-drop-down-menu). Self-Service Analytics duplicates the visual in the Visual Gallery. Unless you change the visual name, the existing visual name is incremented by 1. See [Save Visuals With New Names](/simba-embedded-analytics/docs/self-service-analytics/26.3/analyze-data/visuals/visual-save#save-visuals-with-new-names).

        <br />

        <Note>
          To copy visuals, you must be logged in as an administrator or as a user with the **Create Visuals** or **Administer Visuals** [group privilege](/simba-embedded-analytics/docs/self-service-analytics/26.3/administer/users/aaa-ov#group-privilege-reference).
        </Note>
      </td>
    </tr>
  </tbody>
</table>

<Note>
  Every stored setting for the visual is copied, including sort and limit options, filters, ruler properties and reference lines, colors, time bar options. and other visual information. View levels for maps are not copied.
</Note>