> ## Documentation Index
> Fetch the complete documentation index at: https://insightsoftware.mintlify.site/llms.txt
> Use this file to discover all available pages before exploring further.

# Tables

> Tables of raw data are based on at least one metric and one attribute.

Tables are based on at least one metric and one attribute. They contain a table of the raw data from the data source selected for the visual. Tables are supported by all Self-Service Analytics [data connectors](/simba-embedded-analytics/docs/self-service-analytics/26.3/reference/data-connector-reference).

In addition to tables from raw data, Self-Service Analytics supports pivot tables. See [Pivot Tables](/simba-embedded-analytics/docs/self-service-analytics/26.3/analyze-data/visuals/pivot-tables).

Data from Fusion data sources can be used in tables. However, Self-Service Analytics recommends that you initially use a subset of fields from Fusion data sources on tables of raw data to limit the load on Self-Service Analytics's query engine and improve its performance. You can change the subset in data source configurations and add additional fields, later, as needed while working on a dashboard.

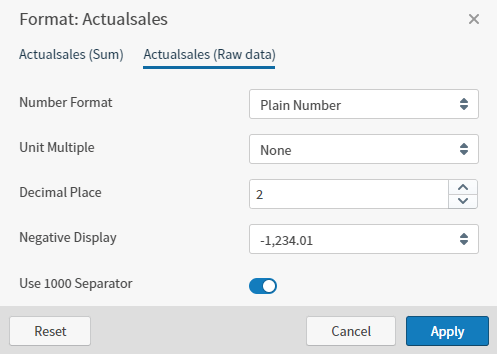
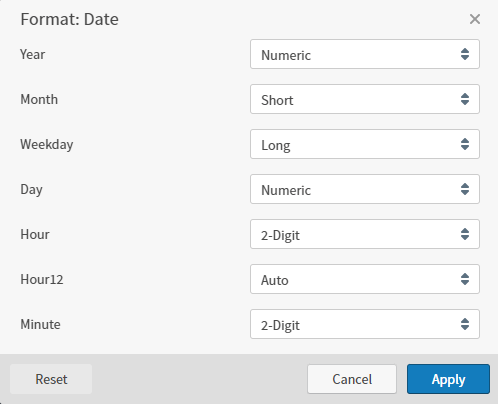
Number field formatting in tables is based on the formatting specified for the numeric field in a data source configuration. You can edit the formatting for specific fields in a table by [editing the numeric format](#format-numeric-table-data-using-the-table-context-menu). Time field formatting in aggregated tables is based on the granularity specified for the time field in the data source configuration.

If you want tables for a data source to support live mode and data playback, be sure that the data source includes a time field and that it meets the requirements for live mode and playback. See [Live Mode and Historical Playback](/simba-embedded-analytics/docs/self-service-analytics/26.3/analyze-data/time-bar#live-mode-and-historical-playback).

<Note>
  Live mode and historical playback do not work for tables when the table is grouped.
</Note>

After you create a table, you can modify the table fields, enlarge or decrease the size of the columns, rearrange the table columns, change the formatting of numeric fields, sort the data by the column headings, and add custom metrics and derived fields. Optionally, select relevant show/hide options for individual metric or time zone labels using the table context menu in the column header.

## Create a New Table Visual

You can create a new table visual in the [visual gallery](/simba-embedded-analytics/docs/self-service-analytics/26.3/analyze-data/visuals/visual-add-dash#create-and-add-visuals-to-the-visual-gallery) or add a [new visual to a dashboard](/simba-embedded-analytics/docs/self-service-analytics/26.3/analyze-data/visuals/visual-add-dash). Generally, you will select a source for your visual, then select a [visual type](/simba-embedded-analytics/docs/self-service-analytics/26.3/analyze-data/visuals/available-visual-types).

When you select a table visual, Self-Service Analytics prompts you to include one or more columns in the initial table. Select the columns you want to include, then create the visual. If you select no columns, all columns are included by default.

You can add, remove, or rearrange the columns as needed at any time. See [Add or Remove Table Columns](#add-or-remove-table-columns) and [ove Table Columns](#ove-table-columns).

### Work with Tables

* [Configure Settings for a Specific Table](#configure-settings-for-a-specific-table)
* [Add or Remove Table Columns](#add-or-remove-table-columns)
* [ove Table Columns](#ove-table-columns)
* [Change Column Widths](#change-column-widths)
* [Group and Ungroup Table Data](#group-and-ungroup-table-data)
* [Apply Even Time Intervals on Tables](/simba-embedded-analytics/docs/self-service-analytics/26.3/analyze-data/dashboards/even-time-interval#apply-even-time-intervals-on-tables)
* [Change Time Field Granularity in Tables](#change-time-field-granularity-in-tables)
* [Change Metric Aggregation in Tables](#change-metric-aggregation-in-tables)
* [Change Table Pagination](#change-table-pagination)
* [Sort Data in a Table](#sort-data-in-a-table)
* [Format Numeric Table Data Using the Table Context Menu](#format-numeric-table-data-using-the-table-context-menu)
* [Format Time Table Data Using the Table Context Menu](#format-time-table-data-using-the-table-context-menu)
* [Table Context Menu](#table-context-menu)
* [Maintain Custom Metrics](/simba-embedded-analytics/docs/self-service-analytics/26.3/connect-to-data/data/custom-metrics)
* [Maintain Derived Fields](/simba-embedded-analytics/docs/self-service-analytics/26.3/connect-to-data/data/derived-fields)
* [Export Visuals](/simba-embedded-analytics/docs/self-service-analytics/26.3/analyze-data/visuals/visual-export-23)

<Note>
  You can use [Keyboard Controls](/simba-embedded-analytics/docs/self-service-analytics/26.3/get-started/welcome#keyboard-controls) on the Table Settings sidebar instead of a mouse.
</Note>

<h2 id="configure-settings-for-a-specific-table">
  Configure Settings for a Specific Table
</h2>

You can configure the settings for a specific table while you are viewing it using the Table Settings sidebar or the [table context menu](#table-context-menu).

See the following topics:

* [Add or Remove Table Columns](#add-or-remove-table-columns)
* [ove Table Columns](#ove-table-columns)
* [Change Column Widths](#change-column-widths)
* [Group and Ungroup Table Data](#group-and-ungroup-table-data)
* [Apply Even Time Intervals on Tables](/simba-embedded-analytics/docs/self-service-analytics/26.3/analyze-data/dashboards/even-time-interval#apply-even-time-intervals-on-tables)
* [Change Time Field Granularity in Tables](#change-time-field-granularity-in-tables)
* [Change Metric Aggregation in Tables](#change-metric-aggregation-in-tables)
* [Change Table Pagination](#change-table-pagination)
* [Sort Data in a Table](#sort-data-in-a-table)
* [Format Numeric Table Data Using the Table Context Menu](#format-numeric-table-data-using-the-table-context-menu)

<h2 id="table-context-menu">
  Table Context Menu
</h2>

The column headings of a table and pivot table include a context menu you can use to perform various functions on the table, as described below. Select <img src="https://mintcdn.com/insightsoftware/sLccJ1EJ28cO5lT_/simba-embedded-analytics/docs/self-service-analytics/26.3/images/icons/more-menu.png?fit=max&auto=format&n=sLccJ1EJ28cO5lT_&q=85&s=1471c7a569a7e100cd7fa4083b04551a" alt="Selet the three dots icon to open a show more menu or take actions for the named column" width="21" height="12" noZoom style={{display: 'inline', verticalAlign: 'middle', width: '21px', height: '12px', margin: '0 2px'}} data-path="simba-embedded-analytics/docs/self-service-analytics/26.3/images/icons/more-menu.png" /> next to the column heading name to access the table context menu. The context menu has two tabs:

* The <img src="https://mintcdn.com/insightsoftware/sLccJ1EJ28cO5lT_/simba-embedded-analytics/docs/self-service-analytics/26.3/images/icons/more-menu.png?fit=max&auto=format&n=sLccJ1EJ28cO5lT_&q=85&s=1471c7a569a7e100cd7fa4083b04551a" alt="Selet the three dots icon to open a show more menu or take actions for the named column" width="21" height="12" noZoom style={{display: 'inline', verticalAlign: 'middle', width: '21px', height: '12px', margin: '0 2px'}} data-path="simba-embedded-analytics/docs/self-service-analytics/26.3/images/icons/more-menu.png" /> tab lists the functions you can perform.
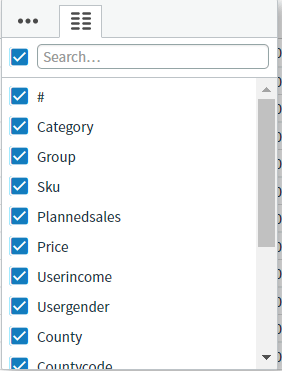
* The <img src="https://mintcdn.com/insightsoftware/cQU1Auv4yvPMjcip/simba-embedded-analytics/docs/self-service-analytics/26.3/images/visuals/rdt-fieldlist.png?fit=max&auto=format&n=cQU1Auv4yvPMjcip&q=85&s=47542d1cbbe1a6760225ea35ac59930b" alt="" width="26" height="25" noZoom style={{display: 'inline', verticalAlign: 'middle', width: '26px', height: '25px', margin: '0 2px'}} data-path="simba-embedded-analytics/docs/self-service-analytics/26.3/images/visuals/rdt-fieldlist.png" /> tab lists all the available fields in the data source.
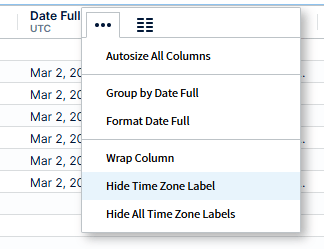
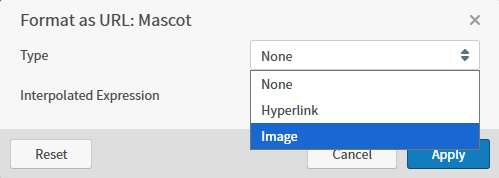
<img src="https://mintcdn.com/insightsoftware/cQU1Auv4yvPMjcip/simba-embedded-analytics/docs/self-service-analytics/26.3/images/visuals/rdt-contextmenu-time.png?fit=max&auto=format&n=cQU1Auv4yvPMjcip&q=85&s=6be5f164bd0a7907559577f441863a72" alt="" width="308" height="304" data-path="simba-embedded-analytics/docs/self-service-analytics/26.3/images/visuals/rdt-contextmenu-time.png" /><img src="https://mintcdn.com/insightsoftware/cQU1Auv4yvPMjcip/simba-embedded-analytics/docs/self-service-analytics/26.3/images/visuals/rdt-contextmenu-num.png?fit=max&auto=format&n=cQU1Auv4yvPMjcip&q=85&s=efb05af8edbfebfd48e4e7946a87d37b" alt="" width="338" height="283" data-path="simba-embedded-analytics/docs/self-service-analytics/26.3/images/visuals/rdt-contextmenu-num.png" /><img src="https://mintcdn.com/insightsoftware/cQU1Auv4yvPMjcip/simba-embedded-analytics/docs/self-service-analytics/26.3/images/visuals/rdt-contextmenu-num-82.png?fit=max&auto=format&n=cQU1Auv4yvPMjcip&q=85&s=e2a1b7d9a7ee587bdc6ca3cb63cadc26" alt="select to format numbers in a table column" width="277" height="135" data-path="simba-embedded-analytics/docs/self-service-analytics/26.3/images/visuals/rdt-contextmenu-num-82.png" /> or <img src="https://mintcdn.com/insightsoftware/cQU1Auv4yvPMjcip/simba-embedded-analytics/docs/self-service-analytics/26.3/images/visuals/rdt-context-menu-date-84.png?fit=max&auto=format&n=cQU1Auv4yvPMjcip&q=85&s=fc20f0b75821a2ba9028ff1fdef15b43" alt="" width="334" height="144" data-path="simba-embedded-analytics/docs/self-service-analytics/26.3/images/visuals/rdt-context-menu-date-84.png" /><img src="https://mintcdn.com/insightsoftware/b9ogX_L4Mqut_Uxb/simba-embedded-analytics/docs/self-service-analytics/26.3/images/visuals/context-menu-hide-01-25-2.png?fit=max&auto=format&n=b9ogX_L4Mqut_Uxb&q=85&s=05ff87b4795aa41e9467b540c4ba59b1" alt="select show and hide metric or timezone options" width="324" height="250" data-path="simba-embedded-analytics/docs/self-service-analytics/26.3/images/visuals/context-menu-hide-01-25-2.png" /><img src="https://mintcdn.com/insightsoftware/b9ogX_L4Mqut_Uxb/simba-embedded-analytics/docs/self-service-analytics/26.3/images/visuals/context-menu-hide-02-25-2.png?fit=max&auto=format&n=b9ogX_L4Mqut_Uxb&q=85&s=e751f1f303bf242b21939cc91d22df50" alt="select show and hide metric or timezone options" width="360" height="386" data-path="simba-embedded-analytics/docs/self-service-analytics/26.3/images/visuals/context-menu-hide-02-25-2.png" />

Possible menu options on the table context menu tab are described below.

<table>
  <thead>
    <tr>
      <th>Menu Option</th>
      <th>Description</th>
    </tr>
  </thead>

  <tbody>
    <tr>
      <td>Aggregation</td>

      <td>
        Shown only for numeric fields or metrics, this option allows you to change the aggregation method for the field.

        <br />

        Valid options are AVG, MIN, MAX, SUM, NONE, or LAST VALUE. See [Change Metric Aggregation in Tables](#change-metric-aggregation-in-tables).
      </td>
    </tr>

    <tr>
      <td>Autosize all columns</td>

      <td>
        This option autosizes all the column widths in the table.

        <br />

        See [Change Column Widths](#change-column-widths).
      </td>
    </tr>

    <tr>
      <td>Format</td>
      <td>Format data or aggregated data in this column. See [Format Numeric Table Data Using the Table Context Menu](#format-numeric-table-data-using-the-table-context-menu).</td>
    </tr>

    <tr>
      <td>Format \<field></td>

      <td>
        Use this option to modify the formatting of numeric and time fields for Table visuals.

        <br />

        See [Format Numeric Table Data Using the Table Context Menu](#format-numeric-table-data-using-the-table-context-menu) or [Format Time Table Data Using the Table Context Menu](#format-time-table-data-using-the-table-context-menu).
      </td>
    </tr>

    <tr>
      <td>Format \<field> as URL</td>
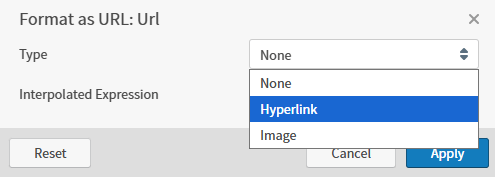
      <td>Format the data in this column as a URL or image. See [Format Images or a URL Using the Table Context Menu](#format-images-or-a-url-using-the-table-context-menu).</td>
    </tr>

    <tr>
      <td>Group by \<field></td>

      <td>
        This option allows you to group the table by the field represented by the table column.

        <br />

        See [Group and Ungroup Table Data](#group-and-ungroup-table-data).
      </td>
    </tr>

    <tr>
      <td>Granularity</td>

      <td>
        Shown only for time fields used to group the table, this option allows you to change the granularity of the grouped time field. Options vary based on the [granularity you define](/simba-embedded-analytics/docs/self-service-analytics/26.3/connect-to-data/data/data-number-formatting#configure-date-and-time-formatting-data-sources) at the source level.

        <br />

        See [Change Time Field Granularity in Tables](#change-time-field-granularity-in-tables).
      </td>
    </tr>

    <tr>
      <td>Hide/Show</td>

      <td>
        * Shown in columns using aggregation, this allows you to hide or show the label of the metric used to aggregate your data.
        * Shown in columns that include time data, this allows you to hide or show the time zone label.
      </td>
    </tr>

    <tr>
      <td>Include Blanks</td>

      <td>
        Shown only for time fields used to group the table, this option allows you apply even time intervals for the grouped time field.

        <br />

        Select this option once to apply even time intervals.

        <br />

        Select it a second time to remove even time intervals.

        <br />

        See [Even Time Intervals](/simba-embedded-analytics/docs/self-service-analytics/26.3/analyze-data/dashboards/even-time-interval).
      </td>
    </tr>

    <tr>
      <td>Reset \<field> sorting</td>
      <td>Shown after you have sorted a column. Select to reset the sort you performed on the unsaved table. See [Sort Data in a Table](#sort-data-in-a-table) or [Sort Data in a Pivot Table](/simba-embedded-analytics/docs/self-service-analytics/26.3/analyze-data/visuals/pivot-tables#sort-data-in-a-pivot-table).</td>
    </tr>

    <tr>
      <td>Reset all sorting</td>
      <td>Shown after you have sorted one or more columns. Select to reset all sorting you performed on the unsaved table. See [Sort Data in a Table](#sort-data-in-a-table) or [Sort Data in a Pivot Table](/simba-embedded-analytics/docs/self-service-analytics/26.3/analyze-data/visuals/pivot-tables#sort-data-in-a-pivot-table).</td>
    </tr>

    <tr>
      <td>Resort other sorting</td>
      <td>Shown after you have sorted one or more columns, but not this column. Select to reset all sorting you performed on the unsaved table. See [Sort Data in a Table](#sort-data-in-a-table) or [Sort Data in a Pivot Table](/simba-embedded-analytics/docs/self-service-analytics/26.3/analyze-data/visuals/pivot-tables#sort-data-in-a-pivot-table).</td>
    </tr>

    <tr>
      <td>Ungroup \<field></td>
      <td>This option removes grouping by the table column. See [Group and Ungroup Table Data](#group-and-ungroup-table-data).</td>
    </tr>

    <tr>
      <td>Wrap Column</td>
      <td>Select to wrap the text or data in a column to improve readability.</td>
    </tr>
  </tbody>
</table>

You can also select and hide a column from a table using the <img src="https://mintcdn.com/insightsoftware/cQU1Auv4yvPMjcip/simba-embedded-analytics/docs/self-service-analytics/26.3/images/visuals/rdt-fieldlist.png?fit=max&auto=format&n=cQU1Auv4yvPMjcip&q=85&s=47542d1cbbe1a6760225ea35ac59930b" alt="" width="26" height="25" noZoom style={{display: 'inline', verticalAlign: 'middle', width: '26px', height: '25px', margin: '0 2px'}} data-path="simba-embedded-analytics/docs/self-service-analytics/26.3/images/visuals/rdt-fieldlist.png" /> tab on the table context menu. See [Select Columns Using the Table Context Menu](#select-columns-using-the-table-context-menu) and [Hide Columns Using the Table Context Menu](#hide-columns-using-the-table-context-menu).

<h2 id="add-or-remove-table-columns">
  Add or Remove Table Columns
</h2>

You can change the columns (fields) that are shown in the raw data table. After you save the dashboard or visual, the columns are retained when you close the dashboard. They are also retained when you share, embed, or export the dashboard or visual.

You can add and remove table columns using the Table Settings sidebar and directly on the table itself, using the table context menu. See the following topics:

* [Select Columns Using the Table Settings Sidebar](#select-columns-using-the-table-settings-sidebar)
* [Select Columns Using the Table Context Menu](#select-columns-using-the-table-context-menu)
* [Hide Columns Using the Table Settings Sidebar](#hide-columns-using-the-table-settings-sidebar)
* [Hide Columns Using the Table Context Menu](#hide-columns-using-the-table-context-menu)

<h2 id="hide-columns-using-the-table-settings-sidebar">
  Hide Columns Using the Table Settings Sidebar
</h2>

**Hide table columns using the Table Settings sidebar**

1. If you are viewing the table in a dashboard, select **Settings** from the [visual drop-down menu](/simba-embedded-analytics/docs/self-service-analytics/26.3/analyze-data/visuals/visual-setup#use-the-visual-drop-down-menu). The [sidebar menu](/simba-embedded-analytics/docs/self-service-analytics/26.3/analyze-data/visuals/visual-setup#use-the-visual-sidebar-menu) for the visual appears.

   If you are viewing the visual from the Visual Gallery, the sidebar appears to the right of the visual.

2. Select settings <img src="https://mintcdn.com/insightsoftware/sLccJ1EJ28cO5lT_/simba-embedded-analytics/docs/self-service-analytics/26.3/images/icons/sidebar-chtsettings.png?fit=max&auto=format&n=sLccJ1EJ28cO5lT_&q=85&s=74af55ee44cca52b9f7f4ae157440a81" alt="Select the settings icon on the sidebar menu to open settings options" width="28" height="33" noZoom style={{display: 'inline', verticalAlign: 'middle', width: '28px', height: '33px', margin: '0 2px'}} data-path="simba-embedded-analytics/docs/self-service-analytics/26.3/images/icons/sidebar-chtsettings.png" /> on the [sidebar menu](/simba-embedded-analytics/docs/self-service-analytics/26.3/analyze-data/visuals/visual-setup#use-the-visual-sidebar-menu). The Table Settings sidebar for the visual appears.

   <img src="https://mintcdn.com/insightsoftware/cQU1Auv4yvPMjcip/simba-embedded-analytics/docs/self-service-analytics/26.3/images/visuals/rdt-group-23-2.png?fit=max&auto=format&n=cQU1Auv4yvPMjcip&q=85&s=f34ff28a48562673d95dde1b0081556f" alt="" width="352" height="1081" data-path="simba-embedded-analytics/docs/self-service-analytics/26.3/images/visuals/rdt-group-23-2.png" />

   Select the add icon <img src="https://mintcdn.com/insightsoftware/sLccJ1EJ28cO5lT_/simba-embedded-analytics/docs/self-service-analytics/26.3/images/icons/add.png?fit=max&auto=format&n=sLccJ1EJ28cO5lT_&q=85&s=9a24b95d9385f23950764407d5e9111a" alt="add icon" width="15" height="15" noZoom data-path="simba-embedded-analytics/docs/self-service-analytics/26.3/images/icons/add.png" /> to access [Custom Metrics Editor](/simba-embedded-analytics/docs/self-service-analytics/26.3/connect-to-data/data/custom-metrics#custom-metrics-editor) or [Derived Field Editor](/simba-embedded-analytics/docs/self-service-analytics/26.3/connect-to-data/data/derived-fields#derived-field-editor).

3. Select the edit icon <img src="https://mintcdn.com/insightsoftware/sLccJ1EJ28cO5lT_/simba-embedded-analytics/docs/self-service-analytics/26.3/images/icons/edit2.png?fit=max&auto=format&n=sLccJ1EJ28cO5lT_&q=85&s=d3604bc03d607058dd859e1c7bd373ff" alt="" width="24" height="23" noZoom style={{display: 'inline', verticalAlign: 'middle', width: '24px', height: '23px', margin: '0 2px'}} data-path="simba-embedded-analytics/docs/self-service-analytics/26.3/images/icons/edit2.png" /> next to **Edit Columns** on the sidebar. The Table Settings sidebar changes and only the fields available in the data source are listed.
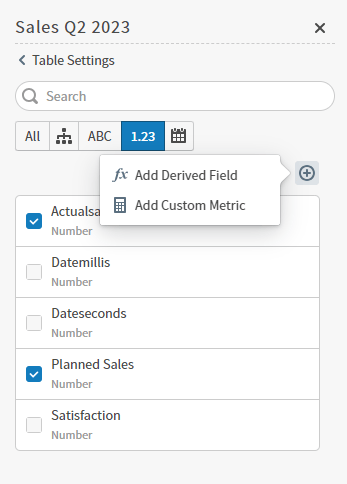
   <img src="https://mintcdn.com/insightsoftware/cQU1Auv4yvPMjcip/simba-embedded-analytics/docs/self-service-analytics/26.3/images/visuals/rdt-edit-cols-23-2-add.png?fit=max&auto=format&n=cQU1Auv4yvPMjcip&q=85&s=38a3b4378ebbc474700289247086ff71" alt="select columns to add and optionally add derived fields or custom metrics" width="347" height="484" data-path="simba-embedded-analytics/docs/self-service-analytics/26.3/images/visuals/rdt-edit-cols-23-2-add.png" />

4. Clear (uncheck) the fields you want to hide from the table.

   There is an alternate, quicker, method for hiding columns in a table.

   Use the search bar to search for a field in the table. Use the buttons under the search bar to limit the fields you see in the list.
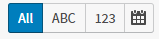
   <img src="https://mintcdn.com/insightsoftware/cQU1Auv4yvPMjcip/simba-embedded-analytics/docs/self-service-analytics/26.3/images/visuals/rdt-settings-search.png?fit=max&auto=format&n=cQU1Auv4yvPMjcip&q=85&s=e3ea4f6a15ef2d21fb1f19108011c014" alt="" width="159" height="39" data-path="simba-embedded-analytics/docs/self-service-analytics/26.3/images/visuals/rdt-settings-search.png" />

   | Select                                                                                                                                                                                                                                                                                                                                                                                                                                                                                                                                                                                                                                                                                                                                                                                                                                                                                                                                                                                                                                                                                                                                                                                                                                                                                                                                                                                                                                                                                                                                                                                                                                                                                                                                                                                                                                                                                                                                                                                                                                                         | To                                                          |
   | -------------------------------------------------------------------------------------------------------------------------------------------------------------------------------------------------------------------------------------------------------------------------------------------------------------------------------------------------------------------------------------------------------------------------------------------------------------------------------------------------------------------------------------------------------------------------------------------------------------------------------------------------------------------------------------------------------------------------------------------------------------------------------------------------------------------------------------------------------------------------------------------------------------------------------------------------------------------------------------------------------------------------------------------------------------------------------------------------------------------------------------------------------------------------------------------------------------------------------------------------------------------------------------------------------------------------------------------------------------------------------------------------------------------------------------------------------------------------------------------------------------------------------------------------------------------------------------------------------------------------------------------------------------------------------------------------------------------------------------------------------------------------------------------------------------------------------------------------------------------------------------------------------------------------------------------------------------------------------------------------------------------------------------------------------------- | ----------------------------------------------------------- |
   | <img src="https://mintcdn.com/insightsoftware/cQU1Auv4yvPMjcip/simba-embedded-analytics/docs/self-service-analytics/26.3/images/visuals/limit-all.png?fit=max&auto=format&n=cQU1Auv4yvPMjcip&q=85&s=6948dbd43cac113a26ccad56f53411b6" alt="" width="36" height="28" noZoom style={{display: 'inline', verticalAlign: 'middle', width: '36px', height: '28px', margin: '0 2px'}} data-path="simba-embedded-analytics/docs/self-service-analytics/26.3/images/visuals/limit-all.png" />                                         | See all available fields.                                   |
   | <img src="https://mintcdn.com/insightsoftware/cQU1Auv4yvPMjcip/simba-embedded-analytics/docs/self-service-analytics/26.3/images/visuals/limit-attr.png?fit=max&auto=format&n=cQU1Auv4yvPMjcip&q=85&s=fe9cfab8dcf5b26aa3721b571dfb95a0" alt="" width="40" height="29" noZoom style={{display: 'inline', verticalAlign: 'middle', width: '40px', height: '29px', margin: '0 2px'}} data-path="simba-embedded-analytics/docs/self-service-analytics/26.3/images/visuals/limit-attr.png" />                                 | Limit the field list to the available attributes.           |
   | <img src="https://mintcdn.com/insightsoftware/cQU1Auv4yvPMjcip/simba-embedded-analytics/docs/self-service-analytics/26.3/images/visuals/limit-numeric.png?fit=max&auto=format&n=cQU1Auv4yvPMjcip&q=85&s=def10348a8c8ea4028225882037598f6" alt="" width="35" height="27" noZoom style={{display: 'inline', verticalAlign: 'middle', width: '35px', height: '27px', margin: '0 2px'}} data-path="simba-embedded-analytics/docs/self-service-analytics/26.3/images/visuals/limit-numeric.png" />         | Limit the field list to the available numeric metrics.      |
   | <img src="https://mintcdn.com/insightsoftware/cQU1Auv4yvPMjcip/simba-embedded-analytics/docs/self-service-analytics/26.3/images/visuals/limit-datetime.png?fit=max&auto=format&n=cQU1Auv4yvPMjcip&q=85&s=5c7c671cb1f01e71112fe7a2efabcd53" alt="" width="28" height="29" noZoom style={{display: 'inline', verticalAlign: 'middle', width: '28px', height: '29px', margin: '0 2px'}} data-path="simba-embedded-analytics/docs/self-service-analytics/26.3/images/visuals/limit-datetime.png" /> | Limit the field list to the available date and time fields. |

5. When you are finished hiding your fields, select **Continue** and examine your updates. If they are correct, select **Apply**.

6. Save the dashboard and visual.
<h3 id="hide-table-columns-using-the-table-settings-sidebar-alternate">
  Hide Table Columns Using the Table Settings Sidebar (Alternate Method)
</h3>

**Quickly hide columns in a table**

1. If you are viewing the table in a dashboard, select **Settings** from the [visual drop-down menu](/simba-embedded-analytics/docs/self-service-analytics/26.3/analyze-data/visuals/visual-setup#use-the-visual-drop-down-menu). The [sidebar menu](/simba-embedded-analytics/docs/self-service-analytics/26.3/analyze-data/visuals/visual-setup#use-the-visual-sidebar-menu) for the visual appears.

   If you are viewing the visual from the Visual Gallery, the sidebar appears to the right of the visual.

2. Select settings <img src="https://mintcdn.com/insightsoftware/sLccJ1EJ28cO5lT_/simba-embedded-analytics/docs/self-service-analytics/26.3/images/icons/sidebar-chtsettings.png?fit=max&auto=format&n=sLccJ1EJ28cO5lT_&q=85&s=74af55ee44cca52b9f7f4ae157440a81" alt="Select the settings icon on the sidebar menu to open settings options" width="28" height="33" noZoom style={{display: 'inline', verticalAlign: 'middle', width: '28px', height: '33px', margin: '0 2px'}} data-path="simba-embedded-analytics/docs/self-service-analytics/26.3/images/icons/sidebar-chtsettings.png" /> on the [sidebar menu](/simba-embedded-analytics/docs/self-service-analytics/26.3/analyze-data/visuals/visual-setup#use-the-visual-sidebar-menu). The Table Settings sidebar for the visual appears.

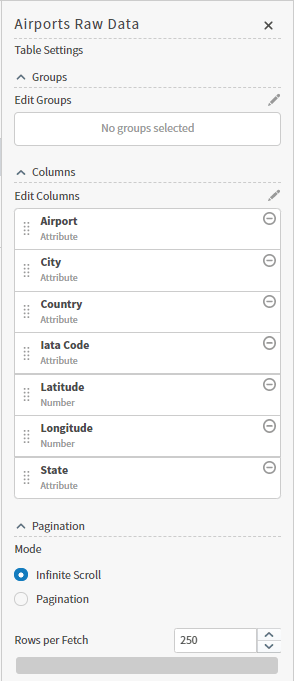
   <img src="https://mintcdn.com/insightsoftware/cQU1Auv4yvPMjcip/simba-embedded-analytics/docs/self-service-analytics/26.3/images/visuals/rdt-settings.png?fit=max&auto=format&n=cQU1Auv4yvPMjcip&q=85&s=45b18d76945d72195eff7764cd74e11e" alt="" width="294" height="681" data-path="simba-embedded-analytics/docs/self-service-analytics/26.3/images/visuals/rdt-settings.png" />

3. In the **Columns** section of the sidebar, select the delete icon <img src="https://mintcdn.com/insightsoftware/sLccJ1EJ28cO5lT_/simba-embedded-analytics/docs/self-service-analytics/26.3/images/icons/delete-open.png?fit=max&auto=format&n=sLccJ1EJ28cO5lT_&q=85&s=02c9cbe530b9f34bd9a73851fdf499e2" alt="" width="16" height="18" noZoom style={{display: 'inline', verticalAlign: 'middle', width: '16px', height: '18px', margin: '0 2px'}} data-path="simba-embedded-analytics/docs/self-service-analytics/26.3/images/icons/delete-open.png" /> corresponding to the columns you want hidden from the table. (You can add them back if needed later.)
4. Select **Apply** to apply your changes to the table.

5. Save the dashboard and visual.

<h2 id="hide-columns-using-the-table-context-menu">
  Hide Columns Using the Table Context Menu
</h2>

**Hide table columns using the table context menu**

1. View the table visual in a dashboard or from the Visual Gallery.

2. Select <img src="https://mintcdn.com/insightsoftware/sLccJ1EJ28cO5lT_/simba-embedded-analytics/docs/self-service-analytics/26.3/images/icons/more-menu.png?fit=max&auto=format&n=sLccJ1EJ28cO5lT_&q=85&s=1471c7a569a7e100cd7fa4083b04551a" alt="Selet the three dots icon to open a show more menu or take actions for the named column" width="21" height="12" noZoom style={{display: 'inline', verticalAlign: 'middle', width: '21px', height: '12px', margin: '0 2px'}} data-path="simba-embedded-analytics/docs/self-service-analytics/26.3/images/icons/more-menu.png" /> next to the column heading name to access the table context menu.

   <img src="https://mintcdn.com/insightsoftware/cQU1Auv4yvPMjcip/simba-embedded-analytics/docs/self-service-analytics/26.3/images/visuals/rdt-contextmenu.png?fit=max&auto=format&n=cQU1Auv4yvPMjcip&q=85&s=ffbd8dee8df96210c206a70e22864fd1" alt="" width="333" height="267" data-path="simba-embedded-analytics/docs/self-service-analytics/26.3/images/visuals/rdt-contextmenu.png" />

3. Select the <img src="https://mintcdn.com/insightsoftware/cQU1Auv4yvPMjcip/simba-embedded-analytics/docs/self-service-analytics/26.3/images/visuals/rdt-fieldlist.png?fit=max&auto=format&n=cQU1Auv4yvPMjcip&q=85&s=47542d1cbbe1a6760225ea35ac59930b" alt="" width="26" height="25" noZoom style={{display: 'inline', verticalAlign: 'middle', width: '26px', height: '25px', margin: '0 2px'}} data-path="simba-embedded-analytics/docs/self-service-analytics/26.3/images/visuals/rdt-fieldlist.png" /> tab on the context menu. A list of all the fields in the data source appears.

   <img src="https://mintcdn.com/insightsoftware/cQU1Auv4yvPMjcip/simba-embedded-analytics/docs/self-service-analytics/26.3/images/visuals/rdt-fieldselect.png?fit=max&auto=format&n=cQU1Auv4yvPMjcip&q=85&s=4ececc4f013f021d5a02a8a453261bad" alt="" width="282" height="371" data-path="simba-embedded-analytics/docs/self-service-analytics/26.3/images/visuals/rdt-fieldselect.png" />

4. Clear (uncheck) the fields you want to hide in the table.

   Use the search bar to search for a field in the table.

   Fields you hide disappear from the table.

5. Save the dashboard and visual.
<h2 id="select-columns-using-the-table-settings-sidebar">
  Select Columns Using the Table Settings Sidebar
</h2>

**Select fields for table columns using the Table Settings sidebar**

1. If you are viewing the table in a dashboard, select **Settings** from the [visual drop-down menu](/simba-embedded-analytics/docs/self-service-analytics/26.3/analyze-data/visuals/visual-setup#use-the-visual-drop-down-menu). The [sidebar menu](/simba-embedded-analytics/docs/self-service-analytics/26.3/analyze-data/visuals/visual-setup#use-the-visual-sidebar-menu) for the visual appears.

   If you are viewing the visual from the Visual Gallery, the sidebar appears to the right of the visual.

2. Select settings <img src="https://mintcdn.com/insightsoftware/sLccJ1EJ28cO5lT_/simba-embedded-analytics/docs/self-service-analytics/26.3/images/icons/sidebar-chtsettings.png?fit=max&auto=format&n=sLccJ1EJ28cO5lT_&q=85&s=74af55ee44cca52b9f7f4ae157440a81" alt="Select the settings icon on the sidebar menu to open settings options" width="28" height="33" noZoom style={{display: 'inline', verticalAlign: 'middle', width: '28px', height: '33px', margin: '0 2px'}} data-path="simba-embedded-analytics/docs/self-service-analytics/26.3/images/icons/sidebar-chtsettings.png" /> on the [sidebar menu](/simba-embedded-analytics/docs/self-service-analytics/26.3/analyze-data/visuals/visual-setup#use-the-visual-sidebar-menu). The Table Settings sidebar for the visual appears.

   <img src="https://mintcdn.com/insightsoftware/cQU1Auv4yvPMjcip/simba-embedded-analytics/docs/self-service-analytics/26.3/images/visuals/rdt-group-23-2.png?fit=max&auto=format&n=cQU1Auv4yvPMjcip&q=85&s=f34ff28a48562673d95dde1b0081556f" alt="" width="352" height="1081" data-path="simba-embedded-analytics/docs/self-service-analytics/26.3/images/visuals/rdt-group-23-2.png" />

3. Select the edit icon <img src="https://mintcdn.com/insightsoftware/sLccJ1EJ28cO5lT_/simba-embedded-analytics/docs/self-service-analytics/26.3/images/icons/edit2.png?fit=max&auto=format&n=sLccJ1EJ28cO5lT_&q=85&s=d3604bc03d607058dd859e1c7bd373ff" alt="" width="24" height="23" noZoom style={{display: 'inline', verticalAlign: 'middle', width: '24px', height: '23px', margin: '0 2px'}} data-path="simba-embedded-analytics/docs/self-service-analytics/26.3/images/icons/edit2.png" /> next to **Edit Columns** on the sidebar. The Table Settings sidebar changes and only the fields available in the data source are listed.

   <img src="https://mintcdn.com/insightsoftware/cQU1Auv4yvPMjcip/simba-embedded-analytics/docs/self-service-analytics/26.3/images/visuals/rdt-edit-cols-23-2-add.png?fit=max&auto=format&n=cQU1Auv4yvPMjcip&q=85&s=38a3b4378ebbc474700289247086ff71" alt="select columns to add and optionally add derived fields or custom metrics" width="347" height="484" data-path="simba-embedded-analytics/docs/self-service-analytics/26.3/images/visuals/rdt-edit-cols-23-2-add.png" />

   Select the add icon <img src="https://mintcdn.com/insightsoftware/sLccJ1EJ28cO5lT_/simba-embedded-analytics/docs/self-service-analytics/26.3/images/icons/add.png?fit=max&auto=format&n=sLccJ1EJ28cO5lT_&q=85&s=9a24b95d9385f23950764407d5e9111a" alt="add icon" width="15" height="15" noZoom data-path="simba-embedded-analytics/docs/self-service-analytics/26.3/images/icons/add.png" /> to access the [Custom Metrics Editor](/simba-embedded-analytics/docs/self-service-analytics/26.3/connect-to-data/data/custom-metrics#custom-metrics-editor) or [Derived Field Editor](/simba-embedded-analytics/docs/self-service-analytics/26.3/connect-to-data/data/derived-fields#derived-field-editor).

4. Select the fields you want to view as columns in the table.

   Use the search bar to search for a field in the table. Use the buttons under the search bar to limit the fields you see in the list.

   <img src="https://mintcdn.com/insightsoftware/cQU1Auv4yvPMjcip/simba-embedded-analytics/docs/self-service-analytics/26.3/images/visuals/rdt-settings-search.png?fit=max&auto=format&n=cQU1Auv4yvPMjcip&q=85&s=e3ea4f6a15ef2d21fb1f19108011c014" alt="" width="159" height="39" data-path="simba-embedded-analytics/docs/self-service-analytics/26.3/images/visuals/rdt-settings-search.png" />

   | Select                                                                                                                                                                                                                                                                                                                                                                                                                                                                                                                                                                                                                                                                                                                                                                                                                                                                                                                                                                                                                                                                                                                                                                                                                                                                                                                                                                                                                                                                                                                                                                                                                                                                                                                                                                                                                                                                                                                                                                                                                                                         | To                                                          |
   | -------------------------------------------------------------------------------------------------------------------------------------------------------------------------------------------------------------------------------------------------------------------------------------------------------------------------------------------------------------------------------------------------------------------------------------------------------------------------------------------------------------------------------------------------------------------------------------------------------------------------------------------------------------------------------------------------------------------------------------------------------------------------------------------------------------------------------------------------------------------------------------------------------------------------------------------------------------------------------------------------------------------------------------------------------------------------------------------------------------------------------------------------------------------------------------------------------------------------------------------------------------------------------------------------------------------------------------------------------------------------------------------------------------------------------------------------------------------------------------------------------------------------------------------------------------------------------------------------------------------------------------------------------------------------------------------------------------------------------------------------------------------------------------------------------------------------------------------------------------------------------------------------------------------------------------------------------------------------------------------------------------------------------------------------------------- | ----------------------------------------------------------- |
   | <img src="https://mintcdn.com/insightsoftware/cQU1Auv4yvPMjcip/simba-embedded-analytics/docs/self-service-analytics/26.3/images/visuals/limit-all.png?fit=max&auto=format&n=cQU1Auv4yvPMjcip&q=85&s=6948dbd43cac113a26ccad56f53411b6" alt="" width="36" height="28" noZoom style={{display: 'inline', verticalAlign: 'middle', width: '36px', height: '28px', margin: '0 2px'}} data-path="simba-embedded-analytics/docs/self-service-analytics/26.3/images/visuals/limit-all.png" />                                         | See all available fields.                                   |
   | <img src="https://mintcdn.com/insightsoftware/cQU1Auv4yvPMjcip/simba-embedded-analytics/docs/self-service-analytics/26.3/images/visuals/limit-attr.png?fit=max&auto=format&n=cQU1Auv4yvPMjcip&q=85&s=fe9cfab8dcf5b26aa3721b571dfb95a0" alt="" width="40" height="29" noZoom style={{display: 'inline', verticalAlign: 'middle', width: '40px', height: '29px', margin: '0 2px'}} data-path="simba-embedded-analytics/docs/self-service-analytics/26.3/images/visuals/limit-attr.png" />                                 | Limit the field list to the available attributes.           |
   | <img src="https://mintcdn.com/insightsoftware/cQU1Auv4yvPMjcip/simba-embedded-analytics/docs/self-service-analytics/26.3/images/visuals/limit-numeric.png?fit=max&auto=format&n=cQU1Auv4yvPMjcip&q=85&s=def10348a8c8ea4028225882037598f6" alt="" width="35" height="27" noZoom style={{display: 'inline', verticalAlign: 'middle', width: '35px', height: '27px', margin: '0 2px'}} data-path="simba-embedded-analytics/docs/self-service-analytics/26.3/images/visuals/limit-numeric.png" />         | Limit the field list to the available numeric metrics.      |
   | <img src="https://mintcdn.com/insightsoftware/cQU1Auv4yvPMjcip/simba-embedded-analytics/docs/self-service-analytics/26.3/images/visuals/limit-datetime.png?fit=max&auto=format&n=cQU1Auv4yvPMjcip&q=85&s=5c7c671cb1f01e71112fe7a2efabcd53" alt="" width="28" height="29" noZoom style={{display: 'inline', verticalAlign: 'middle', width: '28px', height: '29px', margin: '0 2px'}} data-path="simba-embedded-analytics/docs/self-service-analytics/26.3/images/visuals/limit-datetime.png" /> | Limit the field list to the available date and time fields. |

5. When you are finished hiding your fields, select **Continue** and examine your updates. If they are correct, select **Apply**.

6. Save the dashboard and visual.

<h2 id="select-columns-using-the-table-context-menu">
  Select Columns Using the Table Context Menu
</h2>

**Select fields for table columns using the table context menu**

1. View the table visual in a dashboard or from the Visual Gallery.

2. Select <img src="https://mintcdn.com/insightsoftware/sLccJ1EJ28cO5lT_/simba-embedded-analytics/docs/self-service-analytics/26.3/images/icons/more-menu.png?fit=max&auto=format&n=sLccJ1EJ28cO5lT_&q=85&s=1471c7a569a7e100cd7fa4083b04551a" alt="Selet the three dots icon to open a show more menu or take actions for the named column" width="21" height="12" noZoom style={{display: 'inline', verticalAlign: 'middle', width: '21px', height: '12px', margin: '0 2px'}} data-path="simba-embedded-analytics/docs/self-service-analytics/26.3/images/icons/more-menu.png" /> next to the column heading name to access the table context menu.

   <img src="https://mintcdn.com/insightsoftware/cQU1Auv4yvPMjcip/simba-embedded-analytics/docs/self-service-analytics/26.3/images/visuals/rdt-contextmenu.png?fit=max&auto=format&n=cQU1Auv4yvPMjcip&q=85&s=ffbd8dee8df96210c206a70e22864fd1" alt="" width="333" height="267" data-path="simba-embedded-analytics/docs/self-service-analytics/26.3/images/visuals/rdt-contextmenu.png" />

3. Select the <img src="https://mintcdn.com/insightsoftware/cQU1Auv4yvPMjcip/simba-embedded-analytics/docs/self-service-analytics/26.3/images/visuals/rdt-fieldlist.png?fit=max&auto=format&n=cQU1Auv4yvPMjcip&q=85&s=47542d1cbbe1a6760225ea35ac59930b" alt="" width="26" height="25" noZoom style={{display: 'inline', verticalAlign: 'middle', width: '26px', height: '25px', margin: '0 2px'}} data-path="simba-embedded-analytics/docs/self-service-analytics/26.3/images/visuals/rdt-fieldlist.png" /> tab on the context menu. A list of all the fields in the data source appears.

   <img src="https://mintcdn.com/insightsoftware/cQU1Auv4yvPMjcip/simba-embedded-analytics/docs/self-service-analytics/26.3/images/visuals/rdt-fieldselect.png?fit=max&auto=format&n=cQU1Auv4yvPMjcip&q=85&s=4ececc4f013f021d5a02a8a453261bad" alt="" width="282" height="371" data-path="simba-embedded-analytics/docs/self-service-analytics/26.3/images/visuals/rdt-fieldselect.png" />

4. Select the fields you want to view as columns in the table. To select all the fields, select the checkbox to the left of the search bar.

   Use the search bar to search for a field in the table.

   Fields you select appear in the table.

5. Save the dashboard and visual.

<h2 id="ove-table-columns">
  ove Table Columns
</h2>

You can rearrange (move) the columns in a table while you are viewing the table. After you save the dashboard or visual, the column rearrangement is retained after you close the dashboard. It is also retained when you share or export the dashboard or visual.

**Select the columns in a table**

1. If you are editing the visual in a dashboard, select **Settings** from the [visual drop-down menu](/simba-embedded-analytics/docs/self-service-analytics/26.3/analyze-data/visuals/visual-setup#use-the-visual-drop-down-menu). The [sidebar menu](/simba-embedded-analytics/docs/self-service-analytics/26.3/analyze-data/visuals/visual-setup#use-the-visual-sidebar-menu) for the visual appears.

   If you are editing the visual from the Visual Gallery, the sidebar appears to the right of the visual.

2. Select <img src="https://mintcdn.com/insightsoftware/sLccJ1EJ28cO5lT_/simba-embedded-analytics/docs/self-service-analytics/26.3/images/icons/sidebar-chtsettings.png?fit=max&auto=format&n=sLccJ1EJ28cO5lT_&q=85&s=74af55ee44cca52b9f7f4ae157440a81" alt="Select the settings icon on the sidebar menu to open settings options" width="28" height="33" noZoom style={{display: 'inline', verticalAlign: 'middle', width: '28px', height: '33px', margin: '0 2px'}} data-path="simba-embedded-analytics/docs/self-service-analytics/26.3/images/icons/sidebar-chtsettings.png" /> on the [sidebar menu](/simba-embedded-analytics/docs/self-service-analytics/26.3/analyze-data/visuals/visual-setup#use-the-visual-sidebar-menu). The Table Settings sidebar for the visual appears.

   <img src="https://mintcdn.com/insightsoftware/cQU1Auv4yvPMjcip/simba-embedded-analytics/docs/self-service-analytics/26.3/images/visuals/rdt-settings.png?fit=max&auto=format&n=cQU1Auv4yvPMjcip&q=85&s=45b18d76945d72195eff7764cd74e11e" alt="" width="294" height="681" data-path="simba-embedded-analytics/docs/self-service-analytics/26.3/images/visuals/rdt-settings.png" />

3. To move a column, select its name and then drag it up or down in the **Columns** list, as appropriate. The first column in the list will appear on the left side of the table.

4. Select **Apply** to apply your changes to the table.

5. Save the dashboard and visual.

<h2 id="change-column-widths">
  Change Column Widths
</h2>

By default, the columns of a table are 100 pixels wide. You cannot change this default. However, you can enlarge or decrease the size of the table columns by moving the separator delineating each column while the table is open for viewing. After you save the dashboard, your customized column widths are saved when you close the table and when you share or embed it.

You can also request that Self-Service Analytics autosize all the columns in the table.

**Manually change column widths**

1. To change the widths of the columns in the table, drag the separator between two columns in the appropriate direction.
2. [Save](/simba-embedded-analytics/docs/self-service-analytics/26.3/analyze-data/dashboards/dash-manage#save-a-dashboard) the dashboard.

**Autosize all table columns**

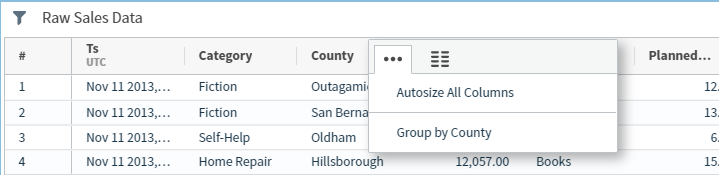
1. Select **Autosize All Columns** in the [context menu](#table-context-menu) of any column in the table.

   <img src="https://mintcdn.com/insightsoftware/cQU1Auv4yvPMjcip/simba-embedded-analytics/docs/self-service-analytics/26.3/images/visuals/rdt-autosize.png?fit=max&auto=format&n=cQU1Auv4yvPMjcip&q=85&s=c8b81c14eef02fde870163465d43b87a" alt="" width="719" height="175" data-path="simba-embedded-analytics/docs/self-service-analytics/26.3/images/visuals/rdt-autosize.png" />

   The table columns are autosized.

2. Save the dashboard and visual.

<h2 id="sort-data-in-a-table">
  Sort Data in a Table
</h2>

The data in the table can be sorted by one or more columns of data. After you save the dashboard or visual, the sort settings are retained when you close it. The sort settings are also retained when you export and share the table.

**Sort the rows in a table by the data in a single column**

* To sort the data in ascending order, select the column heading once.
* To sort the data in descending order, select the column heading two times.
* To return the data to its original sort order, select the column heading three times.

Remember to [save](/simba-embedded-analytics/docs/self-service-analytics/26.3/analyze-data/dashboards/dash-manage#save-a-dashboard) the dashboard to retain the sort order.

**Sort the data rows in a table by the data in multiple columns**

1. Sort the data in ascending or descending order by your first column, as described above.

2. Sort the data in ascending or descending order by your next column as described above. The number 2 appears in the column heading and the data is sorted first by the first column selected, then by the second column selected.

3. Continue adding additional columns to the sort. The numbers in the column headings will continue to increment.

4. Change the order of a multicolumn sort by selecting the column header again.

   * When you select a column that is part of a multicolumn sort again, it becomes the last column of data in sequence for sorting.
   * When you move a column to the end of the sort sequence, Self-Service Analytics renumbers the other columns to reflect the new sort sequence.

5. To clear sorting, hover over a column label, select the table context menu (<img src="https://mintcdn.com/insightsoftware/sLccJ1EJ28cO5lT_/simba-embedded-analytics/docs/self-service-analytics/26.3/images/icons/more-menu.png?fit=max&auto=format&n=sLccJ1EJ28cO5lT_&q=85&s=1471c7a569a7e100cd7fa4083b04551a" alt="Selet the three dots icon to open a show more menu or take actions for the named column" width="21" height="12" noZoom style={{display: 'inline', verticalAlign: 'middle', width: '21px', height: '12px', margin: '0 2px'}} data-path="simba-embedded-analytics/docs/self-service-analytics/26.3/images/icons/more-menu.png" />) and select one of the following options:

   * **Reset \[name] sorting** to clear all sorting options for that column.
   * **Reset other sorting** to clear sorting options for all columns except the one you have selected.
   * **Reset all sorting** to clear all sorting options for all columns.

6. Save the dashboard or visual to save the sort order.

<h2 id="change-table-pagination">
  Change Table Pagination
</h2>

Data is fetched from the data store for a table and cached for viewing in a table visual on a dashboard. Up to 10 times the number of rows specified by **Rows per Fetch** can be cached before Self-Service Analytics purges the earliest data from the cache to make room for more data at the end. For example, if **Rows per Fetch** is set to 250, up to 2500 rows of data are cached at any time.

Control how the data is viewed in a table visual on a dashboard by selecting infinite scroll or pagination for table visuals.

* Select **Infinite Scrolling** to display all the data that has been fetched; view using the scroll bar. When you scroll to the bottom of the fetched data, Self-Service Analytics automatically fetches another block of data (based on the **Rows per Fetch** setting) and the additional data is also available for viewing on the visual (using the scroll bar). For example, if your **Rows per Fetch** setting is 250 rows, the table will initially show all 250 rows of data. When you scroll to the bottom of the data, another 250 rows of data is fetched from the data source and the table will show all 500 rows of data.

* Select **Pagination** to display only the data that will fit in the visual widget for the table. A pagination bar at the bottom of the widget allows you to page forward and backward through the data. Specify the **Rows per Fetch** as needed.

  <img src="https://mintcdn.com/insightsoftware/cQU1Auv4yvPMjcip/simba-embedded-analytics/docs/self-service-analytics/26.3/images/visuals/pagination-bar.png?fit=max&auto=format&n=cQU1Auv4yvPMjcip&q=85&s=9b28b34a930c6f03837198be27ca0ecb" alt="" width="940" height="89" data-path="simba-embedded-analytics/docs/self-service-analytics/26.3/images/visuals/pagination-bar.png" />

<Note>
  If you use pagination, the number of pages of data available to display before more data is fetched from the data store is determined by the size of the visual widget on the dashboard. For example, if your **Rows per Fetch** setting is 250 rows, but your visual widget can only display 30 rows of data, only 30 rows of data are ever shown in the visual. This means that 8.33 pages (250/30) of data are available for viewing. When you page forward (using the forward arrows in the pagination bar) to the end of the fetched data, Self-Service Analytics automatically fetches another block of data (based on the **Rows per Fetch** setting) and fills out any partial page of data with newly fetched data to fill the 30 rows. Additional pages of data are added so you can view the rest of the newly fetched data.
</Note>

By default, infinite scrolling is selected.

**Change the pagination mode for a table**

1. Edit the table you want to modify. See [Edit Visuals](/simba-embedded-analytics/docs/self-service-analytics/26.3/analyze-data/visuals/visual-setup#edit-visuals).

2. If you are editing the visual in a dashboard, select **Settings** from the [visual drop-down menu](/simba-embedded-analytics/docs/self-service-analytics/26.3/analyze-data/visuals/visual-setup#use-the-visual-drop-down-menu). The [sidebar menu](/simba-embedded-analytics/docs/self-service-analytics/26.3/analyze-data/visuals/visual-setup#use-the-visual-sidebar-menu) for the visual appears.

   If you are editing the visual from the Visual Gallery, the sidebar appears to the right of the visual.

3. Select <img src="https://mintcdn.com/insightsoftware/sLccJ1EJ28cO5lT_/simba-embedded-analytics/docs/self-service-analytics/26.3/images/icons/sidebar-chtsettings.png?fit=max&auto=format&n=sLccJ1EJ28cO5lT_&q=85&s=74af55ee44cca52b9f7f4ae157440a81" alt="Select the settings icon on the sidebar menu to open settings options" width="28" height="33" noZoom style={{display: 'inline', verticalAlign: 'middle', width: '28px', height: '33px', margin: '0 2px'}} data-path="simba-embedded-analytics/docs/self-service-analytics/26.3/images/icons/sidebar-chtsettings.png" /> on the [sidebar menu](/simba-embedded-analytics/docs/self-service-analytics/26.3/analyze-data/visuals/visual-setup#use-the-visual-sidebar-menu). The Table Settings sidebar for the visual appears.

   <img src="https://mintcdn.com/insightsoftware/cQU1Auv4yvPMjcip/simba-embedded-analytics/docs/self-service-analytics/26.3/images/visuals/rdt-settings.png?fit=max&auto=format&n=cQU1Auv4yvPMjcip&q=85&s=45b18d76945d72195eff7764cd74e11e" alt="" width="294" height="681" data-path="simba-embedded-analytics/docs/self-service-analytics/26.3/images/visuals/rdt-settings.png" />

4. To modify the pagination mode, expand the Pagination options and select one.

   * Select **Infinite Scroll** to view the data using infinite scrolling. Data is fetched for the next page when the user has scrolled to the bottom of the data shown in the table.
   * Select **Pagination** to view the data using pagination and the forward and back arrows on the pagination bar.
   * Specify **Rows per Fetch** for the table. The default is 250 rows.

5. Select **Apply** to apply your changes to the table.

6. Save the dashboard and visual.

<h2 id="group-and-ungroup-table-data">
  Group and Ungroup Table Data
</h2>

You can group and ungroup table data by one or more fields while you are viewing the table. Summarized totals are provided for numeric fields in each group. The fields used for grouping are automatically moved to the leftmost columns of the table.

Grouping can be set on the table itself using the column heading context menus and using the Table Settings sidebar (a new Group area has been added). In addition, group default settings can be specified for tables in data source configurations.

In environments where [self service reports](/simba-embedded-analytics/docs/self-service-analytics/26.3/analyze-data/ssr-manage) are enabled, the table visual is the primary visual used to generate a report. It supports up to 15 columns of exported data and up to 10 columns of grouped data.

<Note>
  End users will only be able to group table data if the **Group** interactivity setting is enabled. See [Control How Users Interact With a Visual](/simba-embedded-analytics/docs/self-service-analytics/26.3/analyze-data/visuals/visual-interactivity).
</Note>

<Note>
  Live mode and historical playback do not work for tables when the table is grouped.
</Note>

<Note>
  If a table has been grouped, you cannot [export](/simba-embedded-analytics/docs/self-service-analytics/26.3/analyze-data/visuals/visual-export-23) its raw or visual data.
</Note>

This topic covers grouping and ungrouping data using the table context menu and settings sidebar menu.

<h3 id="group-and-ungroup-table-data-table-context-menu">
  Group and Ungroup Table Data - Table Context Menu
</h3>

If a field is selected for grouping, it is automatically selected for the table and cannot be specifically selected as a table column.

When you group table data, summarized totals are provided for numeric fields in each group. The fields used for grouping are automatically moved to the leftmost columns of the table.

<h4 id="group-table-data-table-context-menu">
  Group Table Data - Table Context Menu
</h4>

1. View the table visual in a dashboard, in the Visual Gallery, or in a report. Determine which field you want to use to group the data. For example, you might want to group sales data by state.

2. Locate the field in the table and select <img src="https://mintcdn.com/insightsoftware/sLccJ1EJ28cO5lT_/simba-embedded-analytics/docs/self-service-analytics/26.3/images/icons/more-menu.png?fit=max&auto=format&n=sLccJ1EJ28cO5lT_&q=85&s=1471c7a569a7e100cd7fa4083b04551a" alt="Selet the three dots icon to open a show more menu or take actions for the named column" width="21" height="12" noZoom style={{display: 'inline', verticalAlign: 'middle', width: '21px', height: '12px', margin: '0 2px'}} data-path="simba-embedded-analytics/docs/self-service-analytics/26.3/images/icons/more-menu.png" /> next to its column heading to access the table context menu.

   <img src="https://mintcdn.com/insightsoftware/cQU1Auv4yvPMjcip/simba-embedded-analytics/docs/self-service-analytics/26.3/images/visuals/rdt-contextmenu.png?fit=max&auto=format&n=cQU1Auv4yvPMjcip&q=85&s=ffbd8dee8df96210c206a70e22864fd1" alt="" width="333" height="267" data-path="simba-embedded-analytics/docs/self-service-analytics/26.3/images/visuals/rdt-contextmenu.png" />

3. Select **Group by \<field>** on the context menu.

   The table is grouped by that field.

4. Optionally, select an aggregation level for the group field from the **Aggregation** list. The **Aggregation** list is only available for fields that have aggregation enabled in the data source and if the group field is not the first group field for the table. Optionally, select relevant show/hide options for individual metric labels using the table context menu in the column header.

5. You might want to group the table data by more than one field. For example you might want the sales data that has already been grouped by state to also be grouped by city.

   If you want to group by an additional field, locate the field in the table and select **Group by \<field>** on its context menu.

   The table is grouped by that field within the grouping of any previously selected groups.

6. Save the dashboard, visual, or report.

<h4 id="ungroup-table-data-table-context-menu">
  Ungroup Table Data - Table Context Menu
</h4>

1. View the table visual in a dashboard, in the Visual Gallery, or in a report. Determine which field you want to remove from grouping.

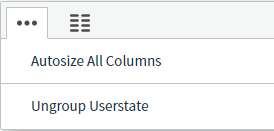
2. Locate the field in the table and select <img src="https://mintcdn.com/insightsoftware/sLccJ1EJ28cO5lT_/simba-embedded-analytics/docs/self-service-analytics/26.3/images/icons/more-menu.png?fit=max&auto=format&n=sLccJ1EJ28cO5lT_&q=85&s=1471c7a569a7e100cd7fa4083b04551a" alt="Selet the three dots icon to open a show more menu or take actions for the named column" width="21" height="12" noZoom style={{display: 'inline', verticalAlign: 'middle', width: '21px', height: '12px', margin: '0 2px'}} data-path="simba-embedded-analytics/docs/self-service-analytics/26.3/images/icons/more-menu.png" /> next to its column heading to access the table context menu.
   <img src="https://mintcdn.com/insightsoftware/cQU1Auv4yvPMjcip/simba-embedded-analytics/docs/self-service-analytics/26.3/images/visuals/rdt-contextmenu-ungroup.png?fit=max&auto=format&n=cQU1Auv4yvPMjcip&q=85&s=37f9faf8221126fa99a645a771194042" alt="" width="274" height="131" data-path="simba-embedded-analytics/docs/self-service-analytics/26.3/images/visuals/rdt-contextmenu-ungroup.png" />

3. Select **Ungroup by \<field>** on the context menu.

   The table is ungrouped by that field.

4. Save the dashboard, visual, or report.

<h2 id="group-and-ungroup-table-data-table-settings-sidebar">
  Group and Ungroup Table Data - Table Settings Sidebar
</h2>

If a field is selected for grouping, it is automatically selected for the table and cannot be specifically selected as a table column.

When you group table data, summarized totals are provided for numeric fields in each group. The fields used for grouping are automatically moved to the leftmost columns of the table.

<h4 id="group-table-data-table-settings-sidebar">
  Group Table Data - Table Settings sidebar
</h4>

1. If you are editing the visual in a dashboard or report, select **Settings** from the [visual drop-down menu](/simba-embedded-analytics/docs/self-service-analytics/26.3/analyze-data/visuals/visual-setup#use-the-visual-drop-down-menu). The [sidebar menu](/simba-embedded-analytics/docs/self-service-analytics/26.3/analyze-data/visuals/visual-setup#use-the-visual-sidebar-menu) for the table appears.

   If you are editing the table from the Visual Gallery or in a report, the sidebar appears to the right of the table.

2. Select <img src="https://mintcdn.com/insightsoftware/sLccJ1EJ28cO5lT_/simba-embedded-analytics/docs/self-service-analytics/26.3/images/icons/sidebar-chtsettings.png?fit=max&auto=format&n=sLccJ1EJ28cO5lT_&q=85&s=74af55ee44cca52b9f7f4ae157440a81" alt="Select the settings icon on the sidebar menu to open settings options" width="28" height="33" noZoom style={{display: 'inline', verticalAlign: 'middle', width: '28px', height: '33px', margin: '0 2px'}} data-path="simba-embedded-analytics/docs/self-service-analytics/26.3/images/icons/sidebar-chtsettings.png" /> on the [sidebar menu](/simba-embedded-analytics/docs/self-service-analytics/26.3/analyze-data/visuals/visual-setup#use-the-visual-sidebar-menu). The Table Settings sidebar for the table appears.

3. Select and drag the field by which you want the table grouped from the **Columns** section of the Table Settings sidebar to the **Groups** section.

   The **Groups** section of the Table Settings sidebar lists the columns by which the table is grouped, in order of that grouping. In the following example, the sales data is grouped first by state, then by city within the state, and then by product category.
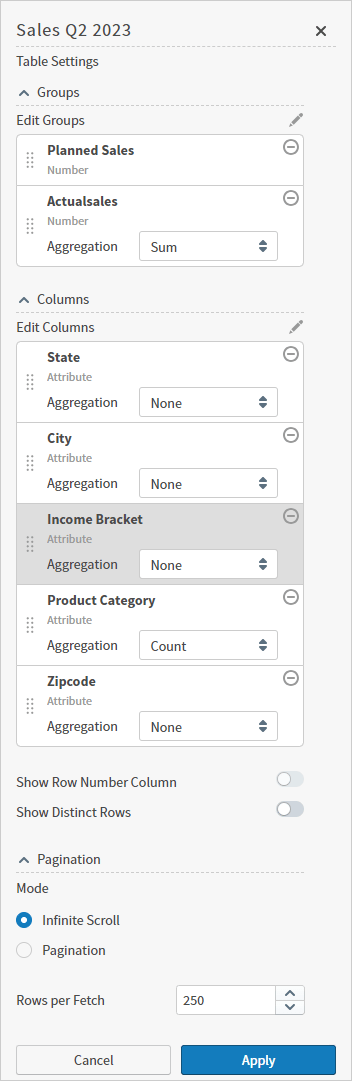
   <img src="https://mintcdn.com/insightsoftware/cQU1Auv4yvPMjcip/simba-embedded-analytics/docs/self-service-analytics/26.3/images/visuals/rdt-group-23-2.png?fit=max&auto=format&n=cQU1Auv4yvPMjcip&q=85&s=f34ff28a48562673d95dde1b0081556f" alt="" width="352" height="1081" data-path="simba-embedded-analytics/docs/self-service-analytics/26.3/images/visuals/rdt-group-23-2.png" />

4. Optionally, select an aggregation level for the group field from the **Aggregation** list. The **Aggregation** list is only available for fields that have aggregation enabled in the data source and only if the group field is not the first group field for the table.

5. Select **Apply** to apply your changes to the table. The grouping selections are applied to the table.

6. Save the dashboard, visual, or report.

<h4 id="ungroup-table-data-table-settings-sidebar">
  Ungroup Table Data - Table Settings sidebar
</h4>

1. If you are editing the visual in a dashboard or report, select **Settings** from the [visual drop-down menu](/simba-embedded-analytics/docs/self-service-analytics/26.3/analyze-data/visuals/visual-setup#use-the-visual-drop-down-menu). The [sidebar menu](/simba-embedded-analytics/docs/self-service-analytics/26.3/analyze-data/visuals/visual-setup#use-the-visual-sidebar-menu) for the table appears.

   If you are editing the visual from the Visual Gallery, the sidebar appears to the right of the visual.

2. Select <img src="https://mintcdn.com/insightsoftware/sLccJ1EJ28cO5lT_/simba-embedded-analytics/docs/self-service-analytics/26.3/images/icons/sidebar-chtsettings.png?fit=max&auto=format&n=sLccJ1EJ28cO5lT_&q=85&s=74af55ee44cca52b9f7f4ae157440a81" alt="Select the settings icon on the sidebar menu to open settings options" width="28" height="33" noZoom style={{display: 'inline', verticalAlign: 'middle', width: '28px', height: '33px', margin: '0 2px'}} data-path="simba-embedded-analytics/docs/self-service-analytics/26.3/images/icons/sidebar-chtsettings.png" /> on the [sidebar menu](/simba-embedded-analytics/docs/self-service-analytics/26.3/analyze-data/visuals/visual-setup#use-the-visual-sidebar-menu). The Table Settings sidebar for the visual appears.

   <img src="https://mintcdn.com/insightsoftware/cQU1Auv4yvPMjcip/simba-embedded-analytics/docs/self-service-analytics/26.3/images/visuals/rdt-group-23-2.png?fit=max&auto=format&n=cQU1Auv4yvPMjcip&q=85&s=f34ff28a48562673d95dde1b0081556f" alt="" width="352" height="1081" data-path="simba-embedded-analytics/docs/self-service-analytics/26.3/images/visuals/rdt-group-23-2.png" />

3. You can remove a field from grouping in several ways:

   1. Select and drag the field from the **Groups** section of the Table Settings sidebar to the **Columns** section.
   2. In the **Groups** section of the sidebar, select <img src="https://mintcdn.com/insightsoftware/sLccJ1EJ28cO5lT_/simba-embedded-analytics/docs/self-service-analytics/26.3/images/icons/delete-open.png?fit=max&auto=format&n=sLccJ1EJ28cO5lT_&q=85&s=02c9cbe530b9f34bd9a73851fdf499e2" alt="" width="16" height="18" noZoom style={{display: 'inline', verticalAlign: 'middle', width: '16px', height: '18px', margin: '0 2px'}} data-path="simba-embedded-analytics/docs/self-service-analytics/26.3/images/icons/delete-open.png" /> corresponding to the field you want removed from grouping.
   3. Select the edit icon (<img src="https://mintcdn.com/insightsoftware/sLccJ1EJ28cO5lT_/simba-embedded-analytics/docs/self-service-analytics/26.3/images/icons/edit2.png?fit=max&auto=format&n=sLccJ1EJ28cO5lT_&q=85&s=d3604bc03d607058dd859e1c7bd373ff" alt="" width="24" height="23" noZoom style={{display: 'inline', verticalAlign: 'middle', width: '24px', height: '23px', margin: '0 2px'}} data-path="simba-embedded-analytics/docs/self-service-analytics/26.3/images/icons/edit2.png" />) for **Edit Groups** on the sidebar menu. The Table Settings sidebar changes and only the fields included are listed. Clear the checkbox of the field you want to remove from grouping. Note that this also removes the field from the table and you must manually add it back if you want its column shown in the table. Select **Continue** when you have completed your changes.

4. Select **Apply** to apply your changes to the table.

5. Save the dashboard, visual, or report.

<h2 id="change-metric-aggregation-in-tables">
  Change Metric Aggregation in Tables
</h2>

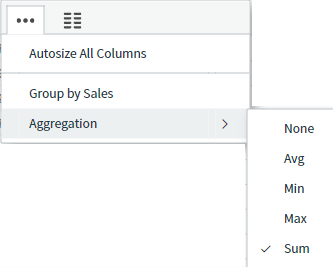
You can change the aggregation of metrics in a table after the table has been grouped. Aggregation settings can be changed on the Table Settings sidebar and using the table context menu. Note that you cannot change the aggregation setting for a metric that is used in grouping the table. When a metric is used to group a table, the sum of that field is used for grouping.

<Note>
  End users will only be able to change aggregation of numeric and metric fields in a table if the **Metrics** interactivity setting is enabled. See [Control How Users Interact With a Visual](/simba-embedded-analytics/docs/self-service-analytics/26.3/analyze-data/visuals/visual-interactivity).
</Note>

See the following topics:

* [Change Aggregation Using the Table Context Menu](#change-aggregation-using-the-table-context-menu)
* [Change Aggregation Using the Table Settings Sidebar](#change-aggregation-using-the-table-settings-sidebar)

For information about aggregation values, see [Metric Aggregation Functions](/simba-embedded-analytics/docs/self-service-analytics/26.3/connect-to-data/data/fx-aggregate#metric-aggregation-functions).

<h2 id="change-aggregation-using-the-table-settings-sidebar">
  Change Aggregation Using the Table Settings Sidebar
</h2>

**Change the aggregation of metrics in a table using the Table Settings sidebar**

1. [Edit](/simba-embedded-analytics/docs/self-service-analytics/26.3/analyze-data/dashboards/dash-manage#edit-a-dashboard) a dashboard with a table that uses a data source containing metric fields.

2. Group the table. See [Group and Ungroup Table Data](#group-and-ungroup-table-data).

3. If you are viewing the table in a dashboard, select **Settings** from the [visual drop-down menu](/simba-embedded-analytics/docs/self-service-analytics/26.3/analyze-data/visuals/visual-setup#use-the-visual-drop-down-menu). The [sidebar menu](/simba-embedded-analytics/docs/self-service-analytics/26.3/analyze-data/visuals/visual-setup#use-the-visual-sidebar-menu) for the visual appears.

   If you are viewing the visual from the Visual Gallery, the sidebar appears to the right of the visual.

4. Select <img src="https://mintcdn.com/insightsoftware/sLccJ1EJ28cO5lT_/simba-embedded-analytics/docs/self-service-analytics/26.3/images/icons/sidebar-chtsettings.png?fit=max&auto=format&n=sLccJ1EJ28cO5lT_&q=85&s=74af55ee44cca52b9f7f4ae157440a81" alt="Select the settings icon on the sidebar menu to open settings options" width="28" height="33" noZoom style={{display: 'inline', verticalAlign: 'middle', width: '28px', height: '33px', margin: '0 2px'}} data-path="simba-embedded-analytics/docs/self-service-analytics/26.3/images/icons/sidebar-chtsettings.png" /> on the [sidebar menu](/simba-embedded-analytics/docs/self-service-analytics/26.3/analyze-data/visuals/visual-setup#use-the-visual-sidebar-menu). The Table Settings sidebar for the visual appears.

   <img src="https://mintcdn.com/insightsoftware/cQU1Auv4yvPMjcip/simba-embedded-analytics/docs/self-service-analytics/26.3/images/visuals/rdt-group-23-2.png?fit=max&auto=format&n=cQU1Auv4yvPMjcip&q=85&s=f34ff28a48562673d95dde1b0081556f" alt="" width="352" height="1081" data-path="simba-embedded-analytics/docs/self-service-analytics/26.3/images/visuals/rdt-group-23-2.png" />

5. In any of the metric fields in the **Columns** section of the sidebar, select the aggregation method you want. Possible aggregation methods include **None**, **Avg**, **Min**, **Max**, **Sum**, **Last Value**, **Count**, and **Distinct Count**. For information about aggregation methods, see [Metric Aggregation Functions](/simba-embedded-analytics/docs/self-service-analytics/26.3/connect-to-data/data/fx-aggregate#metric-aggregation-functions).

   The selected aggregation method is applied to the metric.

6. Select **Apply** to apply your changes to the table.

7. Save the dashboard and visual.

<h2 id="change-aggregation-using-the-table-context-menu">
  Change Aggregation Using the Table Context Menu
</h2>

**Change the aggregation metrics in a table using the table context menu**

1. [Edit](/simba-embedded-analytics/docs/self-service-analytics/26.3/analyze-data/dashboards/dash-manage#edit-a-dashboard) a dashboard with a table that uses a data source containing metric fields.

2. Group the table. See [Group and Ungroup Table Data](#group-and-ungroup-table-data).

3. Select <img src="https://mintcdn.com/insightsoftware/sLccJ1EJ28cO5lT_/simba-embedded-analytics/docs/self-service-analytics/26.3/images/icons/more-menu.png?fit=max&auto=format&n=sLccJ1EJ28cO5lT_&q=85&s=1471c7a569a7e100cd7fa4083b04551a" alt="Selet the three dots icon to open a show more menu or take actions for the named column" width="21" height="12" noZoom style={{display: 'inline', verticalAlign: 'middle', width: '21px', height: '12px', margin: '0 2px'}} data-path="simba-embedded-analytics/docs/self-service-analytics/26.3/images/icons/more-menu.png" /> next to the column heading name of any metric field in the table to access the table context menu.
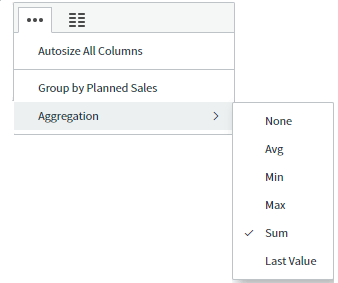
   <img src="https://mintcdn.com/insightsoftware/cQU1Auv4yvPMjcip/simba-embedded-analytics/docs/self-service-analytics/26.3/images/visuals/rdt-contextmenu-num.png?fit=max&auto=format&n=cQU1Auv4yvPMjcip&q=85&s=efb05af8edbfebfd48e4e7946a87d37b" alt="" width="338" height="283" data-path="simba-embedded-analytics/docs/self-service-analytics/26.3/images/visuals/rdt-contextmenu-num.png" />

4. In any of the metric fields in the **Columns** section of the sidebar, select the aggregation method you want. Possible aggregation methods include **None**, **Avg**, **Min**, **Max**, **Sum**, **Last Value**, **Count**, and **Distinct Count**. For information about aggregation methods, see [Metric Aggregation Functions](/simba-embedded-analytics/docs/self-service-analytics/26.3/connect-to-data/data/fx-aggregate#metric-aggregation-functions).

   The selected aggregation method is applied to the metric. Optionally, select relevant show/hide options for individual labels using the table context menu in the column header.

5. Save the dashboard and visual.

<h2 id="change-time-field-granularity-in-tables">
  Change Time Field Granularity in Tables
</h2>

You can change the granularity of a time field in a table using the table context menu if you group the table by the time field.

**Change the granularity of a time field on a table**

1. [Edit](/simba-embedded-analytics/docs/self-service-analytics/26.3/analyze-data/dashboards/dash-manage#edit-a-dashboard) a dashboard with a table that uses a data source containing date or time fields.

2. Group the table by a time field in the data. See [Group and Ungroup Table Data](#group-and-ungroup-table-data).

3. Select <img src="https://mintcdn.com/insightsoftware/sLccJ1EJ28cO5lT_/simba-embedded-analytics/docs/self-service-analytics/26.3/images/icons/more-menu.png?fit=max&auto=format&n=sLccJ1EJ28cO5lT_&q=85&s=1471c7a569a7e100cd7fa4083b04551a" alt="Selet the three dots icon to open a show more menu or take actions for the named column" width="21" height="12" noZoom style={{display: 'inline', verticalAlign: 'middle', width: '21px', height: '12px', margin: '0 2px'}} data-path="simba-embedded-analytics/docs/self-service-analytics/26.3/images/icons/more-menu.png" /> next to the time field column heading to access the table context menu.
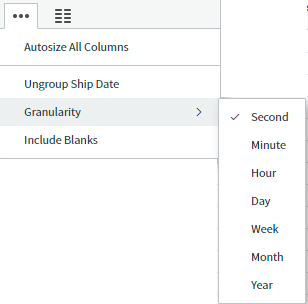
   <img src="https://mintcdn.com/insightsoftware/cQU1Auv4yvPMjcip/simba-embedded-analytics/docs/self-service-analytics/26.3/images/visuals/rdt-contextmenu-time.png?fit=max&auto=format&n=cQU1Auv4yvPMjcip&q=85&s=6be5f164bd0a7907559577f441863a72" alt="" width="308" height="304" data-path="simba-embedded-analytics/docs/self-service-analytics/26.3/images/visuals/rdt-contextmenu-time.png" />

4. Select **Granularity** on the context menu and then select the granularity you want on the submenu that appears. Valid granularity options include **Millisecond**, **Second**, **Minute**, **Hour**, **Day**, **Week**, **Month**, **Quarter** and **Year**. Options vary based on the [granularity you define](/simba-embedded-analytics/docs/self-service-analytics/26.3/connect-to-data/data/data-number-formatting#configure-date-and-time-formatting-data-sources) at the source level.

   The selected granularity is applied to the time field.

5. Save the dashboard and visual.

<h2 id="format-numeric-table-data-using-the-table-context-menu">
  Format Numeric Table Data Using the Table Context Menu
</h2>

Numeric data and date formats [are set at the source](/simba-embedded-analytics/docs/self-service-analytics/26.3/connect-to-data/sources/data-source-config-fields-tab#settings-panel-fields-tab). You can change them directly in a table or pivot table using the table context menu. Your format changes apply directly to that visual, and affects every instance of that visual in your dashboards, without affecting the underlying source formatting. See [Format Time Table Data Using the Table Context Menu](#format-time-table-data-using-the-table-context-menu). To edit number for other visuals, see [Number and Date Formatting for Visuals](/simba-embedded-analytics/docs/self-service-analytics/26.3/analyze-data/visuals/vis-number-formatting).

**Format numeric table data using the table context menu**

1. Select a table visual in a dashboard or in the Visual Gallery.

2. Locate the field in the table and select <img src="https://mintcdn.com/insightsoftware/sLccJ1EJ28cO5lT_/simba-embedded-analytics/docs/self-service-analytics/26.3/images/icons/more-menu.png?fit=max&auto=format&n=sLccJ1EJ28cO5lT_&q=85&s=1471c7a569a7e100cd7fa4083b04551a" alt="Selet the three dots icon to open a show more menu or take actions for the named column" width="21" height="12" noZoom style={{display: 'inline', verticalAlign: 'middle', width: '21px', height: '12px', margin: '0 2px'}} data-path="simba-embedded-analytics/docs/self-service-analytics/26.3/images/icons/more-menu.png" /> next to its column heading to access the table context menu.
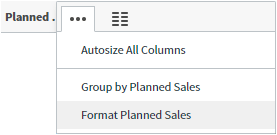
   <img src="https://mintcdn.com/insightsoftware/cQU1Auv4yvPMjcip/simba-embedded-analytics/docs/self-service-analytics/26.3/images/visuals/rdt-contextmenu-num-82.png?fit=max&auto=format&n=cQU1Auv4yvPMjcip&q=85&s=e2a1b7d9a7ee587bdc6ca3cb63cadc26" alt="select to format numbers in a table column" width="277" height="135" data-path="simba-embedded-analytics/docs/self-service-analytics/26.3/images/visuals/rdt-contextmenu-num-82.png" />

3. Select **Format \<field>** on the context menu. A Format work area opens.

   <img src="https://mintcdn.com/insightsoftware/cQU1Auv4yvPMjcip/simba-embedded-analytics/docs/self-service-analytics/26.3/images/visuals/rdt-format-num-82.png?fit=max&auto=format&n=cQU1Auv4yvPMjcip&q=85&s=b8a249013a656774d89721fcd629eb3f" alt="select formatting options in the format work area" width="500" height="307" data-path="simba-embedded-analytics/docs/self-service-analytics/26.3/images/visuals/rdt-format-num-82.png" />

   <Note>
     Select a Number Format, then select other options for this field. Select **Apply** to apply your changes to the data in the table column, or **Reset** reapply the source formatting.
   </Note>

   The other fields on the Format dialog change based on the Number Format you select. See [Number Format Options](#number-format-options).

4. Optionally, repeat for other fields in the table.

5. Save the visual, or the dashboard and visual.

**Format aggregated data using the table context menu**

1. Select a table visual in a dashboard or in the Visual Gallery.

2. Locate the field that includes aggregated in the table and select <img src="https://mintcdn.com/insightsoftware/sLccJ1EJ28cO5lT_/simba-embedded-analytics/docs/self-service-analytics/26.3/images/icons/more-menu.png?fit=max&auto=format&n=sLccJ1EJ28cO5lT_&q=85&s=1471c7a569a7e100cd7fa4083b04551a" alt="Selet the three dots icon to open a show more menu or take actions for the named column" width="21" height="12" noZoom style={{display: 'inline', verticalAlign: 'middle', width: '21px', height: '12px', margin: '0 2px'}} data-path="simba-embedded-analytics/docs/self-service-analytics/26.3/images/icons/more-menu.png" /> next to its column heading to access the table context menu.
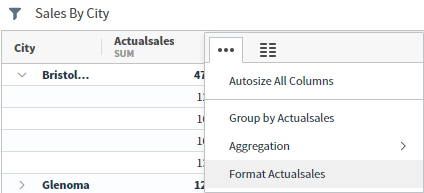
   <img src="https://mintcdn.com/insightsoftware/cQU1Auv4yvPMjcip/simba-embedded-analytics/docs/self-service-analytics/26.3/images/visuals/rdt-context-num-agg-82.png?fit=max&auto=format&n=cQU1Auv4yvPMjcip&q=85&s=7e59189c595f67fc0383b31f32d8d840" alt="select to format aggregated numbers in a table column" width="424" height="193" data-path="simba-embedded-analytics/docs/self-service-analytics/26.3/images/visuals/rdt-context-num-agg-82.png" />

3. Select **Format \<field>** on the context menu. A Format work area opens.

   <img src="https://mintcdn.com/insightsoftware/cQU1Auv4yvPMjcip/simba-embedded-analytics/docs/self-service-analytics/26.3/images/visuals/rdt-format-num-agg-82.png?fit=max&auto=format&n=cQU1Auv4yvPMjcip&q=85&s=a7831c90d3173121040a76f542191b09" alt="select formatting options in the format work area for raw or aggregated numbers" width="497" height="354" data-path="simba-embedded-analytics/docs/self-service-analytics/26.3/images/visuals/rdt-format-num-agg-82.png" />

4. Select the tab of the data you want to format: the aggregate data, shown here as **Actualsales (Sum)**, or the raw data, shown here as **Actualsales (Raw data)**.
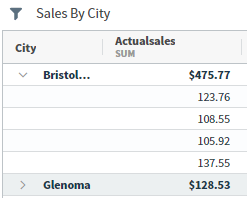
   <Note>
     You can apply different formatting options to your raw and aggregate data.
   </Note>

   <img src="https://mintcdn.com/insightsoftware/cQU1Auv4yvPMjcip/simba-embedded-analytics/docs/self-service-analytics/26.3/images/visuals/rdt-format-options-82.png?fit=max&auto=format&n=cQU1Auv4yvPMjcip&q=85&s=9ca7cf2e0525de29064220bc065746e3" alt="table with different formatting options applied to aggregate and raw data" width="247" height="198" data-path="simba-embedded-analytics/docs/self-service-analytics/26.3/images/visuals/rdt-format-options-82.png" />

5. Select a Number Format, then select other options for this field. select **Apply** to apply your changes to the data in the table column, or **Reset** reapply the source formatting.

   <Note>
     The other fields on the Format dialog change based on the Number Format you select. See [Number Format Options](#number-format-options).
   </Note>

6. Optionally, repeat for other fields in the table.

7. Save the visual, or the dashboard and visual.

<h3 id="number-format-options">
  Number Format Options
</h3>

The available fields for each number format change to reflect the options available for your selected format:

* **Plain Number**: Select this format to display the field as plain number values. Additional format information you can select includes:

  | Format Option      | Description                                                                                                                                                                                                                                                                                       |
  | ------------------ | ------------------------------------------------------------------------------------------------------------------------------------------------------------------------------------------------------------------------------------------------------------------------------------------------- |
  | Unit Multiple      | Select the unit of measure you want to use for the field from the drop-down list. Valid values are **None**, **Thousands (K)**, **Millions (M)**, **Billions (B)**, and **Trillions (T)**. The unit multiple is used in visuals. For example, a value of 1,500,000 would show as 1.5M in visuals. |
  | Decimal Place      | Specify the number of decimal places used in the data.                                                                                                                                                                                                                                            |
  | Negative Display   | Select the desired negative value format from the drop-down list. Valid values are the dash (-) in front of a negative value or parentheses surrounding negative values. For example, value of negative 30 could show as -30 or (30) in visuals.                                                  |
  | Use 1000 Separator | If you want commas used to separate number values into thousands, millions, billions, and trillions, check the **Use 1000 Separator** box. For example, if this box is checked, 2500 appears as 2,500 in visuals.                                                                                 |

* **Percentage**: Select this format to display the field as percentage values. Additional format information you can select includes:

  | Format Option      | Description                                                                                                                                                                                                                                                         |
  | ------------------ | ------------------------------------------------------------------------------------------------------------------------------------------------------------------------------------------------------------------------------------------------------------------- |
  | Decimal Place      | Specify the number of decimal places used in the data.                                                                                                                                                                                                              |
  | Negative Display   | Select the desired negative value format from the drop-down list. Valid values are the dash (-) in front of a negative value or parentheses surrounding negative values. For example, value of negative 30.25 percent could show as -30.25% or (30.25%) in visuals. |
  | Use 1000 Separator | If you want commas used to separate number values into thousands, millions, billions, and trillions, check the **Use 1000 Separator** box.                                                                                                                          |

* **Money**: Select this format to display the field as currency values. Additional format information you can select includes:

  | Format Option      | Description                                                                                                                                                                                                                                                                                       |
  | ------------------ | ------------------------------------------------------------------------------------------------------------------------------------------------------------------------------------------------------------------------------------------------------------------------------------------------- |
  | Symbol             | Select the currency symbol you want used for money values in visuals.                                                                                                                                                                                                                             |
  | Unit Multiple      | Select the unit of measure you want to use for the field from the drop-down list. Valid values are **None**, **Thousands (K)**, **Millions (M)**, **Billions (B)**, and **Trillions (T)**. The unit multiple is used in visuals. For example, a value of 1,500,000 would show as 1.5M in visuals. |
  | Decimal Place      | Specify the number of decimal places used in the data.                                                                                                                                                                                                                                            |
  | Negative Display   | Select the desired negative value format from the drop-down list. Valid values are the dash (-) in front of a negative value or parentheses surrounding negative values. For example, value of negative 30 dollars and 25 cents could show as -\$30.25 or (\$30.25) in visuals.                   |
  | Use 1000 Separator | If you want commas used to separate number values into thousands, millions, billions, and trillions, check the **Use 1000 Separator** box.                                                                                                                                                        |

* **Storage**: Select this format to display the field as computer storage values. Additional format information you can select includes:

  | Format Option | Description                                                                                                                                                                                                                                                                                                                                              |
  | ------------- | -------------------------------------------------------------------------------------------------------------------------------------------------------------------------------------------------------------------------------------------------------------------------------------------------------------------------------------------------------- |
  | Unit Multiple | Select the unit of measure you want to use for the field from the drop-down list. Valid values are **Bytes (B)**, **Kilobytes (KB)**, **Megabytes (MB)**, **Gigabytes (GB)**, **Terabytes (TB)**, **Petabytes (PB)**, and **Exabytes (EB)**. The unit multiple is used in visuals. For example, a value of 950 kilobytes would show as 950KB in visuals. |
  | Decimal Place | Specify the number of decimal places used in the data.                                                                                                                                                                                                                                                                                                   |

* **Scientific Notation**: Select this format to display the field as scientific decimals. Additional format information you can select includes:

  | Format Option | Description                                            |
  | ------------- | ------------------------------------------------------ |
  | Decimal Place | Specify the number of decimal places used in the data. |

<h2 id="format-time-table-data-using-the-table-context-menu">
  Format Time Table Data Using the Table Context Menu
</h2>

Numeric data and time formats [are set at the source](/simba-embedded-analytics/docs/self-service-analytics/26.3/connect-to-data/sources/data-source-config-fields-tab#settings-panel-fields-tab). You can change them directly in a table using the table context menu. Your format changes apply directly to that visual, and affects every instance of that visual in your dashboards, without affecting the underlying source formatting. See [Format Numeric Table Data Using the Table Context Menu](#format-numeric-table-data-using-the-table-context-menu). To edit date and time formatting for other visuals, see [Configure Date and Time Formatting](/simba-embedded-analytics/docs/self-service-analytics/26.3/analyze-data/visuals/vis-number-formatting#configure-date-and-time-formatting).

**Format time table data using the table context menu**

1. Select a table visual in a dashboard or in the Visual Gallery.

2. Locate the field in the table and select <img src="https://mintcdn.com/insightsoftware/sLccJ1EJ28cO5lT_/simba-embedded-analytics/docs/self-service-analytics/26.3/images/icons/more-menu.png?fit=max&auto=format&n=sLccJ1EJ28cO5lT_&q=85&s=1471c7a569a7e100cd7fa4083b04551a" alt="Selet the three dots icon to open a show more menu or take actions for the named column" width="21" height="12" noZoom style={{display: 'inline', verticalAlign: 'middle', width: '21px', height: '12px', margin: '0 2px'}} data-path="simba-embedded-analytics/docs/self-service-analytics/26.3/images/icons/more-menu.png" /> next to its column heading to access the table context menu.
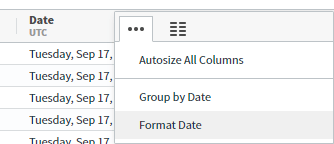
   <img src="https://mintcdn.com/insightsoftware/cQU1Auv4yvPMjcip/simba-embedded-analytics/docs/self-service-analytics/26.3/images/visuals/rdt-context-menu-date-84.png?fit=max&auto=format&n=cQU1Auv4yvPMjcip&q=85&s=fc20f0b75821a2ba9028ff1fdef15b43" alt="select to format date time in a table column" width="334" height="144" data-path="simba-embedded-analytics/docs/self-service-analytics/26.3/images/visuals/rdt-context-menu-date-84.png" />

3. Select **Format \<field>** on the context menu. A Format work area opens.

   <img src="https://mintcdn.com/insightsoftware/cQU1Auv4yvPMjcip/simba-embedded-analytics/docs/self-service-analytics/26.3/images/visuals/rdt-format-date-time-84.png?fit=max&auto=format&n=cQU1Auv4yvPMjcip&q=85&s=b8490af7117161f1998668a93bddae70" alt="select formatting options in the format work area" width="498" height="404" data-path="simba-embedded-analytics/docs/self-service-analytics/26.3/images/visuals/rdt-format-date-time-84.png" />

4. Select the appropriate date formats from available options. Options vary based on the [granularity you define](/simba-embedded-analytics/docs/self-service-analytics/26.3/connect-to-data/data/data-number-formatting#configure-date-and-time-formatting-data-sources) at the source level. See [Date Time Format Options](#date-time-format-options). Select **Apply** to apply your changes to the data in the table column, or **Reset** reapply the source formatting.

5. Optionally, repeat for other fields in the table.

6. Save the visual, or the dashboard and visual.

**Format aggregated data using the table context menu**

1. Select a table visual in a dashboard or in the Visual Gallery.

2. Locate the field that includes aggregated in the table and select <img src="https://mintcdn.com/insightsoftware/sLccJ1EJ28cO5lT_/simba-embedded-analytics/docs/self-service-analytics/26.3/images/icons/more-menu.png?fit=max&auto=format&n=sLccJ1EJ28cO5lT_&q=85&s=1471c7a569a7e100cd7fa4083b04551a" alt="Selet the three dots icon to open a show more menu or take actions for the named column" width="21" height="12" noZoom style={{display: 'inline', verticalAlign: 'middle', width: '21px', height: '12px', margin: '0 2px'}} data-path="simba-embedded-analytics/docs/self-service-analytics/26.3/images/icons/more-menu.png" /> next to its column heading to access the table context menu.
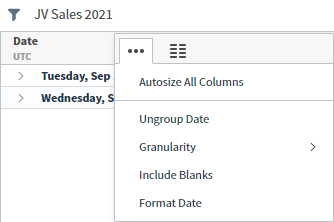
   <img src="https://mintcdn.com/insightsoftware/cQU1Auv4yvPMjcip/simba-embedded-analytics/docs/self-service-analytics/26.3/images/visuals/rtd-context-date-time-agg-84.png?fit=max&auto=format&n=cQU1Auv4yvPMjcip&q=85&s=c7aedbd73a82eaf6f546124305f566ed" alt="select to format aggregated date in a table column" width="334" height="222" data-path="simba-embedded-analytics/docs/self-service-analytics/26.3/images/visuals/rtd-context-date-time-agg-84.png" />

3. Select **Format \<field>** on the context menu. A Format work area opens.

   <img src="https://mintcdn.com/insightsoftware/cQU1Auv4yvPMjcip/simba-embedded-analytics/docs/self-service-analytics/26.3/images/visuals/rdt-format-date-time-84.png?fit=max&auto=format&n=cQU1Auv4yvPMjcip&q=85&s=b8490af7117161f1998668a93bddae70" alt="select formatting options in the format work area" width="498" height="404" data-path="simba-embedded-analytics/docs/self-service-analytics/26.3/images/visuals/rdt-format-date-time-84.png" />

4. Select the appropriate date formats from available options. Options vary based on the [granularity you define](/simba-embedded-analytics/docs/self-service-analytics/26.3/connect-to-data/data/data-number-formatting#configure-date-and-time-formatting-data-sources) at the source level. See [Date Time Format Options](#date-time-format-options). Select **Apply** to apply your changes to the data in the table column, or **Reset** reapply the source formatting.

5. Optionally, repeat for other fields in the table. You can also show or hide the time zone label using the show and hide table context menu options.

6. Save the visual, or the dashboard and visual.

<h3 id="date-time-format-options">
  Date Time Format Options
</h3>

The available fields vary based on the data available in the field.

Not all fields may be available for all time formats.

<table>
  <thead>
    <tr>
      <th>Format Option</th>
      <th>Description</th>
    </tr>
  </thead>

  <tbody>
    <tr>
      <td>Year</td>
      <td>Select **None**, **Numeric** (2024), **2-Digit** (24), **Narrow**, or **Short**.</td>
    </tr>

    <tr>
      <td>Day Of Year</td>
      <td>Select **None** or **Short**.</td>
    </tr>

    <tr>
      <td>Quarter</td>
      <td>Select **None**, **Range**, **Narrow**, **Numeric** (1-4), or **2-Digit** (01-04). Selections for Quarter are applied only if the time granularity is set to Quarter. Not all options may be available for all time fields.</td>
    </tr>

    <tr>
      <td>Month</td>
      <td>Select **None**, **Numeric** (1-12), **2-Digit** (01-12), **Long** (January, March), **Short** (Jan, Mar), or **Narrow** (J, M).</td>
    </tr>

    <tr>
      <td>Week</td>
      <td>Select **None**, **WeekStart**, **WeekEnd**, **Range**, **Narrow** (w1-w53), **Numeric** (1-53), or **2-Digit** (01-53).</td>
    </tr>

    <tr>
      <td>Weekday</td>
      <td>Select **Long** (Friday, Sunday), **Short** (Fri, Sun), **Narrow** (F, S), or **None**. The default is **None**, to show no day of the week.</td>
    </tr>

    <tr>
      <td>Day</td>
      <td>Select **None**, **Numeric** (1-7), **2-Digit** (01-07), **Narrow**, or **Short**.</td>
    </tr>

    <tr>
      <td>Hour</td>
      <td>Select **Numeric** (1-24) or **2-Digit** (01-24).</td>
    </tr>

    <tr>
      <td>Hour12</td>

      <td>
        Select a 12 or 24 hour format option for Hour12.

        <br />

        * **Auto** displays the hour format defined in the source data.
        * **True** overrides the source format, displaying the hours in 12 hour format, with an appended **AM** or **PM**.
        * **False** overrides the source format, displaying the hours in 24 hour format.
      </td>
    </tr>

    <tr>
      <td>Minute</td>
      <td>Select **Numeric** (0-59) or **2-Digit** (00-59).</td>
    </tr>

    <tr>
      <td>Second</td>
      <td>Select **Numeric** (0-59) or **2-Digit** (00-59).</td>
    </tr>
  </tbody>
</table>

<h2 id="format-images-or-a-url-using-the-table-context-menu">
  Format Images or a URL Using the Table Context Menu
</h2>

You can include images or URLs included with your data source in a table to allow users to select and navigate to the hyperlink, or view images associated with the data. Use the table context menu to define the size of images

**Format a hyperlink (URL) using the table context menu**

1. Select a table visual in a dashboard or in the Visual Gallery.

2. Locate the field in the table and select <img src="https://mintcdn.com/insightsoftware/sLccJ1EJ28cO5lT_/simba-embedded-analytics/docs/self-service-analytics/26.3/images/icons/more-menu.png?fit=max&auto=format&n=sLccJ1EJ28cO5lT_&q=85&s=1471c7a569a7e100cd7fa4083b04551a" alt="Selet the three dots icon to open a show more menu or take actions for the named column" width="21" height="12" noZoom style={{display: 'inline', verticalAlign: 'middle', width: '21px', height: '12px', margin: '0 2px'}} data-path="simba-embedded-analytics/docs/self-service-analytics/26.3/images/icons/more-menu.png" /> next to its column heading to access the table context menu.
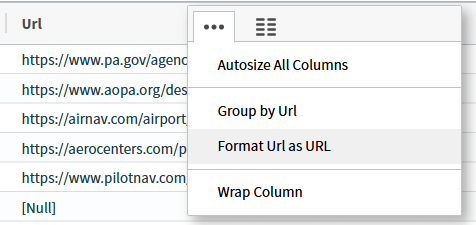
   <img src="https://mintcdn.com/insightsoftware/cQU1Auv4yvPMjcip/simba-embedded-analytics/docs/self-service-analytics/26.3/images/visuals/rdt-context-menu-url-24.png?fit=max&auto=format&n=cQU1Auv4yvPMjcip&q=85&s=7ed2cd44fed100ff04f5e865467df275" alt="select to format a URLin a table column" width="476" height="225" data-path="simba-embedded-analytics/docs/self-service-analytics/26.3/images/visuals/rdt-context-menu-url-24.png" />

3. Select **Format \<field> as URL** on the context menu. A Format as URL work area opens.

   <img src="https://mintcdn.com/insightsoftware/cQU1Auv4yvPMjcip/simba-embedded-analytics/docs/self-service-analytics/26.3/images/visuals/rdt-format-url-24.png?fit=max&auto=format&n=cQU1Auv4yvPMjcip&q=85&s=4dcb280bf79af66780feddea7a9d7a79" alt="Format as URL work area select hyperlink" width="495" height="177" data-path="simba-embedded-analytics/docs/self-service-analytics/26.3/images/visuals/rdt-format-url-24.png" />

4. Select **Hyperlink**, then **Apply**. The URL is formatted in the table as a hyperlink users can select to navigate to the referenced site.

5. You can optionally apply an **Interpolated Expression** to the end of the hyperlink, such as a referrer or other access information.

<Note>
  Remove the hyperlink by selecting again, then None from the Type. Select **Apply** to apply your changes.
</Note>

**Format an image using the table context menu**

1. Select a table visual in a dashboard or in the Visual Gallery.

2. Locate the field in the table and select <img src="https://mintcdn.com/insightsoftware/sLccJ1EJ28cO5lT_/simba-embedded-analytics/docs/self-service-analytics/26.3/images/icons/more-menu.png?fit=max&auto=format&n=sLccJ1EJ28cO5lT_&q=85&s=1471c7a569a7e100cd7fa4083b04551a" alt="Selet the three dots icon to open a show more menu or take actions for the named column" width="21" height="12" noZoom style={{display: 'inline', verticalAlign: 'middle', width: '21px', height: '12px', margin: '0 2px'}} data-path="simba-embedded-analytics/docs/self-service-analytics/26.3/images/icons/more-menu.png" /> next to its column heading to access the table context menu.
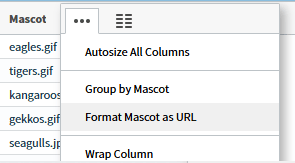
   <img src="https://mintcdn.com/insightsoftware/cQU1Auv4yvPMjcip/simba-embedded-analytics/docs/self-service-analytics/26.3/images/visuals/rdt-context-menu-img-24.png?fit=max&auto=format&n=cQU1Auv4yvPMjcip&q=85&s=97ca94f8c8498491c5138e12f63856ec" alt="select to format an image a table column" width="295" height="163" data-path="simba-embedded-analytics/docs/self-service-analytics/26.3/images/visuals/rdt-context-menu-img-24.png" />

3. Select **Format \<field> as URL** on the context menu. A Format as URL work area opens.

   <img src="https://mintcdn.com/insightsoftware/cQU1Auv4yvPMjcip/simba-embedded-analytics/docs/self-service-analytics/26.3/images/visuals/rdt-format-img-24.png?fit=max&auto=format&n=cQU1Auv4yvPMjcip&q=85&s=421daa35568710ba88fc7d9d16c7908f" alt="Format as URL work area select Image" width="499" height="178" data-path="simba-embedded-analytics/docs/self-service-analytics/26.3/images/visuals/rdt-format-img-24.png" />

4. Select **Image**. The work area expands to allow you to add more information.
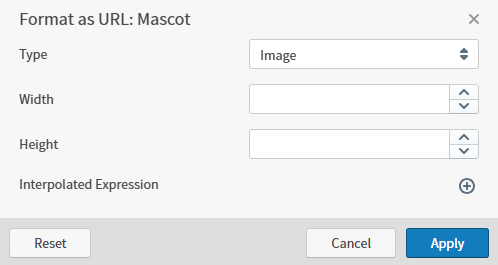
   <img src="https://mintcdn.com/insightsoftware/cQU1Auv4yvPMjcip/simba-embedded-analytics/docs/self-service-analytics/26.3/images/visuals/rdt-img-detail.png?fit=max&auto=format&n=cQU1Auv4yvPMjcip&q=85&s=257c4ddfec69d93fff3541e4e9f252b4" alt="add width and heigh information here by pixel" width="498" height="265" data-path="simba-embedded-analytics/docs/self-service-analytics/26.3/images/visuals/rdt-img-detail.png" />

5. Add the **Width** and **Height** of your image as you want it to display in pixels. Select **Apply** to apply your changes.