> ## Documentation Index
> Fetch the complete documentation index at: https://insightsoftware.mintlify.site/llms.txt
> Use this file to discover all available pages before exploring further.
# Pivot Tables
> Pivot tables are tables of summarized statistics.
Pivot tables are tables of summarized statistics. They are useful for finding unique values for a field. If needed, you can [add custom metrics](/simba-embedded-analytics/docs/self-service-analytics/26.3/connect-to-data/data/custom-metrics) to your pivot table metrics.
Pivot tables are supported by all Self-Service Analytics [data connectors](/simba-embedded-analytics/docs/self-service-analytics/26.3/reference/data-connector-reference) except Cloudera Search. They are supported by Self-Service Analytics Apache Solr connectors for version 5.2 or later.
When you select a table metric, the context menu appears. See [Use the Context Menu](/simba-embedded-analytics/docs/self-service-analytics/26.3/analyze-data/visuals/visual-interactivity#use-the-context-menu).
When you select the table context menu ( ) in a column header, you can [sort your data](#sort-data-in-a-pivot-table), autosize your columns, show or hide metric labels, and collapse or expand all rows for hierarchies.
After you create a pivot table, you can alter the rows, columns, metrics and metric layouts, and horizontal scroll bar used in a pivot table. In addition, you can sort the data in the table and rearrange the table fields. See the following topics:
* [Configure Settings for a Specific Pivot Table](#configure-settings-for-a-specific-pivot-table)
* [Modify Pivot Table Rows](#modify-pivot-table-rows)
* [Modify Pivot Table Columns and Column Widths](#modify-pivot-table-columns-and-column-widths)
* [Modify Pivot Table Metrics and Metric Layout](#modify-pivot-table-metrics-and-metric-layout)
* [Rearrange Pivot Table Fields](#rearrange-pivot-table-fields)
* [Sort Data in a Pivot Table](#sort-data-in-a-pivot-table)
You can use [Keyboard Controls](/simba-embedded-analytics/docs/self-service-analytics/26.3/get-started/welcome#keyboard-controls) on the Pivot Table sidebar instead of a mouse.
You can configure the settings for a specific pivot table while you are viewing it.
**Change the settings for a specific pivot table**
1. Edit the pivot table you want to modify. See [Edit Visuals](/simba-embedded-analytics/docs/self-service-analytics/26.3/analyze-data/visuals/visual-setup#edit-visuals).
2. If you are editing the visual in a dashboard, select **Settings** from the [visual drop-down menu](/simba-embedded-analytics/docs/self-service-analytics/26.3/analyze-data/visuals/visual-setup#use-the-visual-drop-down-menu). The [sidebar menu](/simba-embedded-analytics/docs/self-service-analytics/26.3/analyze-data/visuals/visual-setup#use-the-visual-sidebar-menu) for the visual appears.
If you are editing the visual from the Visual Gallery, the sidebar appears to the right of the visual.
3. Select the settings icon (
) in a column header, you can [sort your data](#sort-data-in-a-pivot-table), autosize your columns, show or hide metric labels, and collapse or expand all rows for hierarchies.
After you create a pivot table, you can alter the rows, columns, metrics and metric layouts, and horizontal scroll bar used in a pivot table. In addition, you can sort the data in the table and rearrange the table fields. See the following topics:
* [Configure Settings for a Specific Pivot Table](#configure-settings-for-a-specific-pivot-table)
* [Modify Pivot Table Rows](#modify-pivot-table-rows)
* [Modify Pivot Table Columns and Column Widths](#modify-pivot-table-columns-and-column-widths)
* [Modify Pivot Table Metrics and Metric Layout](#modify-pivot-table-metrics-and-metric-layout)
* [Rearrange Pivot Table Fields](#rearrange-pivot-table-fields)
* [Sort Data in a Pivot Table](#sort-data-in-a-pivot-table)
You can use [Keyboard Controls](/simba-embedded-analytics/docs/self-service-analytics/26.3/get-started/welcome#keyboard-controls) on the Pivot Table sidebar instead of a mouse.
You can configure the settings for a specific pivot table while you are viewing it.
**Change the settings for a specific pivot table**
1. Edit the pivot table you want to modify. See [Edit Visuals](/simba-embedded-analytics/docs/self-service-analytics/26.3/analyze-data/visuals/visual-setup#edit-visuals).
2. If you are editing the visual in a dashboard, select **Settings** from the [visual drop-down menu](/simba-embedded-analytics/docs/self-service-analytics/26.3/analyze-data/visuals/visual-setup#use-the-visual-drop-down-menu). The [sidebar menu](/simba-embedded-analytics/docs/self-service-analytics/26.3/analyze-data/visuals/visual-setup#use-the-visual-sidebar-menu) for the visual appears.
If you are editing the visual from the Visual Gallery, the sidebar appears to the right of the visual.
3. Select the settings icon ( ) on the [sidebar menu](/simba-embedded-analytics/docs/self-service-analytics/26.3/analyze-data/visuals/visual-setup#use-the-visual-sidebar-menu). The Pivot Table Settings sidebar for the visual appears.
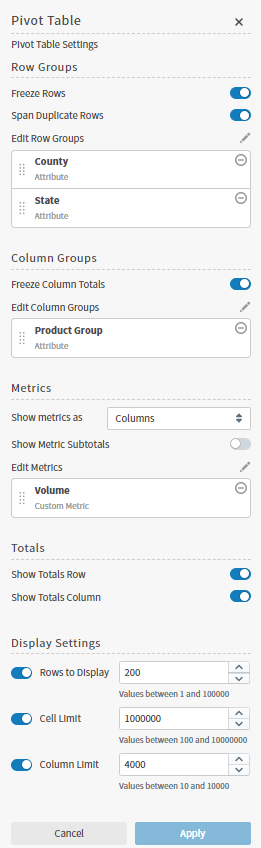 4. Alter the settings as needed. See the following topics:
* [Modify Pivot Table Rows](#modify-pivot-table-rows)
* [Modify Pivot Table Columns and Column Widths](#modify-pivot-table-columns-and-column-widths)
* [Modify Pivot Table Metrics and Metric Layout](#modify-pivot-table-metrics-and-metric-layout)
5. Adjust the **Display Settings** to expand or limit your pivot table visual as needed.
* Leave all options disabled to include all data in your pivot table.
* Enable and adjust any of these options to limit the data included in your pivot table.
* Options include: **Define Rows to Display**, **Cell Limit**, and **Column Limit**.
6. Optionally, edit the number or date and time format for this visual. See [Number and Date Formatting for Visuals](/simba-embedded-analytics/docs/self-service-analytics/26.3/analyze-data/visuals/vis-number-formatting) and [Configure Date and Time Formatting](/simba-embedded-analytics/docs/self-service-analytics/26.3/analyze-data/visuals/vis-number-formatting#configure-date-and-time-formatting).
7. Select the save icon (
4. Alter the settings as needed. See the following topics:
* [Modify Pivot Table Rows](#modify-pivot-table-rows)
* [Modify Pivot Table Columns and Column Widths](#modify-pivot-table-columns-and-column-widths)
* [Modify Pivot Table Metrics and Metric Layout](#modify-pivot-table-metrics-and-metric-layout)
5. Adjust the **Display Settings** to expand or limit your pivot table visual as needed.
* Leave all options disabled to include all data in your pivot table.
* Enable and adjust any of these options to limit the data included in your pivot table.
* Options include: **Define Rows to Display**, **Cell Limit**, and **Column Limit**.
6. Optionally, edit the number or date and time format for this visual. See [Number and Date Formatting for Visuals](/simba-embedded-analytics/docs/self-service-analytics/26.3/analyze-data/visuals/vis-number-formatting) and [Configure Date and Time Formatting](/simba-embedded-analytics/docs/self-service-analytics/26.3/analyze-data/visuals/vis-number-formatting#configure-date-and-time-formatting).
7. Select the save icon ( ) to save the dashboard and the visual with its updated settings.
Rearrange Pivot Table Fields
You can rearrange the fields in a pivot table. After you save the dashboard or visual, the field rearrangement is retained when you close the dashboard. It is also retained when you share or export the dashboard or visual.
**Rearrange the fields in a pivot table**
1. Edit the pivot table you want to modify. See [Edit Visuals](/simba-embedded-analytics/docs/self-service-analytics/26.3/analyze-data/visuals/visual-setup#edit-visuals).
2. If you are editing the visual in a dashboard, select **Settings** from the [visual drop-down menu](/simba-embedded-analytics/docs/self-service-analytics/26.3/analyze-data/visuals/visual-setup#use-the-visual-drop-down-menu). The [sidebar menu](/simba-embedded-analytics/docs/self-service-analytics/26.3/analyze-data/visuals/visual-setup#use-the-visual-sidebar-menu) for the visual appears.
If you are editing the visual from the Visual Gallery, the sidebar appears to the right of the visual.
3. To move a field, select its name and then drag it up or down in the list, as appropriate. You can drag fields between the Row and Column lists on the sidebar, in addition to rearranging fields within their own lists. You cannot drag fields in or out of the Metrics list to the other lists; you can only rearrange fields within the Metrics list.
4. Select **Apply** to apply your changes to the pivot table.
5. [Save](/simba-embedded-analytics/docs/self-service-analytics/26.3/analyze-data/dashboards/dash-manage#save-a-dashboard) the dashboard.
Modify Pivot Table Metrics and Metric Layout
The metric layout can be rows or columns. It identifies the direction in which you want the metric heading (as rows or as columns). It changes how the data is presented in the table in the user interface.
**Modify the layout of metric used for the table**
1. Edit the pivot table you want to modify. See [Edit Visuals](/simba-embedded-analytics/docs/self-service-analytics/26.3/analyze-data/visuals/visual-setup#edit-visuals).
2. If you are editing the visual in a dashboard, select **Settings** from the [visual drop-down menu](/simba-embedded-analytics/docs/self-service-analytics/26.3/analyze-data/visuals/visual-setup#use-the-visual-drop-down-menu). The [sidebar menu](/simba-embedded-analytics/docs/self-service-analytics/26.3/analyze-data/visuals/visual-setup#use-the-visual-sidebar-menu) for the visual appears.
If you are editing the visual from the Visual Gallery, the sidebar appears to the right of the visual.
3. Select the settings icon () on the [sidebar menu](/simba-embedded-analytics/docs/self-service-analytics/26.3/analyze-data/visuals/visual-setup#use-the-visual-sidebar-menu). The Pivot Table Settings sidebar for the visual appears.
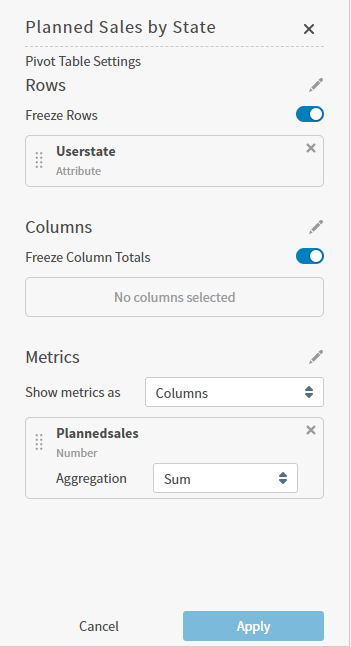 4. Select the metric layout you want in the **Show metrics as** drop-down menu. Use the option **Columns** or **Rows** to select which is shown in the user interface.
When you export a visual that includes this metric, the column option is used.
5. Optionally modify the metrics in the pivot table:
* Select the edit icon (
4. Select the metric layout you want in the **Show metrics as** drop-down menu. Use the option **Columns** or **Rows** to select which is shown in the user interface.
When you export a visual that includes this metric, the column option is used.
5. Optionally modify the metrics in the pivot table:
* Select the edit icon ( ) in the Metrics area of the Configure Pivot sidebar. The sidebar changes to show all the possible metrics for the table.
* Select the metrics you want to add and clear the ones you want to remove. If you want to select all the columns, select **Select All**. Use the search bar at the top of the sidebar to search for a field. When you select
) in the Metrics area of the Configure Pivot sidebar. The sidebar changes to show all the possible metrics for the table.
* Select the metrics you want to add and clear the ones you want to remove. If you want to select all the columns, select **Select All**. Use the search bar at the top of the sidebar to search for a field. When you select  on the search bar, a filter drop-down menu appears so you can list only fields of a specific type (Number, Attribute, or Time).
* Select **OK**.
You can modify the method by which the metric is aggregated (AVG, MIN, MAX, SUM, or LAST VALUE). See [Metric Aggregation Functions](/simba-embedded-analytics/docs/self-service-analytics/26.3/connect-to-data/data/fx-aggregate#metric-aggregation-functions).
6. Select **Apply** to apply your changes to the pivot table. Optionally, select relevant show/hide options for individual metric labels using the table context menu in the column header.
7. [Save](/simba-embedded-analytics/docs/self-service-analytics/26.3/analyze-data/dashboards/dash-manage#save-a-dashboard) the dashboard.
on the search bar, a filter drop-down menu appears so you can list only fields of a specific type (Number, Attribute, or Time).
* Select **OK**.
You can modify the method by which the metric is aggregated (AVG, MIN, MAX, SUM, or LAST VALUE). See [Metric Aggregation Functions](/simba-embedded-analytics/docs/self-service-analytics/26.3/connect-to-data/data/fx-aggregate#metric-aggregation-functions).
6. Select **Apply** to apply your changes to the pivot table. Optionally, select relevant show/hide options for individual metric labels using the table context menu in the column header.
7. [Save](/simba-embedded-analytics/docs/self-service-analytics/26.3/analyze-data/dashboards/dash-manage#save-a-dashboard) the dashboard.
Modify Pivot Table Columns and Column Widths
You can modify the columns used for a pivot table.
**Adjust pivot table columns**
1. Edit the pivot table you want to modify. See [Edit Visuals](/simba-embedded-analytics/docs/self-service-analytics/26.3/analyze-data/visuals/visual-setup#edit-visuals).
2. If you are editing the visual in a dashboard, select **Settings** from the [visual drop-down menu](/simba-embedded-analytics/docs/self-service-analytics/26.3/analyze-data/visuals/visual-setup#use-the-visual-drop-down-menu). The [sidebar menu](/simba-embedded-analytics/docs/self-service-analytics/26.3/analyze-data/visuals/visual-setup#use-the-visual-sidebar-menu) for the visual appears.
If you are editing the visual from the Visual Gallery, the sidebar appears to the right of the visual.
3. Select on the [sidebar menu](/simba-embedded-analytics/docs/self-service-analytics/26.3/analyze-data/visuals/visual-setup#use-the-visual-sidebar-menu). The Pivot Table Settings sidebar for the visual appears.
4. To modify the columns in the pivot table:
* Select in the Columns area of the Pivot Table Settings sidebar. The sidebar changes to show all the possible rows for the table.
* Select the rows you want to add and clear the ones you want to remove. If you want to select all the rows, select **Select All**.
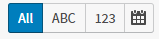
Use the search bar to search for a field in the table. Use the buttons under the search bar to limit the fields you see in the list.
 | Select | To |
| -------------------------------------------------------------------------------------------------------------------------------------------------------------------------------------------------------------------------------------------------------------------------------------------------------------------------------------------------------------------------------------------------------------------------------------------------------------------------------------------------------------------------------------------------------------------------------------------------------------------------------------------------------------------------------------------------------------------------------------------------------------------------------------------------------------------------------------------------------------------------------------------------------------------------------------------------------------------------------------------------------------------------------------------------------------------------------------------------------------------------------------------------------------------------------------------------------------------------------------------------------------------------------------------------------------------------------------------------------------------------------------------------------------------------------------------------------------------------------------------------------------------------------------------------------------------------------------------------------------------------------------------------------------------------------------------------------------------------------------------------------------------------------------------------------------------------------------------------------------------------------------------------------------------------------------------------------------------------------------------------------------------------------------------------------------- | ----------------------------------------------------------- |
|
| Select | To |
| -------------------------------------------------------------------------------------------------------------------------------------------------------------------------------------------------------------------------------------------------------------------------------------------------------------------------------------------------------------------------------------------------------------------------------------------------------------------------------------------------------------------------------------------------------------------------------------------------------------------------------------------------------------------------------------------------------------------------------------------------------------------------------------------------------------------------------------------------------------------------------------------------------------------------------------------------------------------------------------------------------------------------------------------------------------------------------------------------------------------------------------------------------------------------------------------------------------------------------------------------------------------------------------------------------------------------------------------------------------------------------------------------------------------------------------------------------------------------------------------------------------------------------------------------------------------------------------------------------------------------------------------------------------------------------------------------------------------------------------------------------------------------------------------------------------------------------------------------------------------------------------------------------------------------------------------------------------------------------------------------------------------------------------------------------------- | ----------------------------------------------------------- |
|  | See all available fields. |
|
| See all available fields. |
|  | Limit the field list to the available attributes. |
|
| Limit the field list to the available attributes. |
|  | Limit the field list to the available numeric metrics. |
|
| Limit the field list to the available numeric metrics. |
|  | Limit the field list to the available date and time fields. |
* After all column fields are selected, select **Apply**.
If the field you select is a time field, you can modify its granularity and indicate whether or not blanks (even time intervals) should be included in the time field values.
For hierarchical columns, you can show or hide rollup options by enabling or disabling **Show Rollup Labels**.
5. Select **Apply** to apply your changes to the pivot table.
6. Optionally enlarge or decrease the size of pivot table columns while the table is open for viewing.
To change the column widths of a pivot table, drag the separator between two columns in the appropriate direction, or select **Autosize All Columns** from the menu in any header.
After you save the dashboard or visual, your customized column widths are saved.
7. You may want to control whether the Totals column appearing in the rightmost column of the table is frozen on the page (not affected by horizontal scrolling) or unfrozen (only visible when you have scrolled all way to the right).
By default, the Totals column is frozen on the pivot table (it appears regardless of scrolling actions). To unfreeze the Totals column, slide the **Freeze Rows** slider in the Columns section of the Pivot Table Settings sidebar to the left (off The Totals column will no longer be visible unless you scroll the table all the way to the right.
8. [Save](/simba-embedded-analytics/docs/self-service-analytics/26.3/analyze-data/dashboards/dash-manage#save-a-dashboard) the dashboard.
| Limit the field list to the available date and time fields. |
* After all column fields are selected, select **Apply**.
If the field you select is a time field, you can modify its granularity and indicate whether or not blanks (even time intervals) should be included in the time field values.
For hierarchical columns, you can show or hide rollup options by enabling or disabling **Show Rollup Labels**.
5. Select **Apply** to apply your changes to the pivot table.
6. Optionally enlarge or decrease the size of pivot table columns while the table is open for viewing.
To change the column widths of a pivot table, drag the separator between two columns in the appropriate direction, or select **Autosize All Columns** from the menu in any header.
After you save the dashboard or visual, your customized column widths are saved.
7. You may want to control whether the Totals column appearing in the rightmost column of the table is frozen on the page (not affected by horizontal scrolling) or unfrozen (only visible when you have scrolled all way to the right).
By default, the Totals column is frozen on the pivot table (it appears regardless of scrolling actions). To unfreeze the Totals column, slide the **Freeze Rows** slider in the Columns section of the Pivot Table Settings sidebar to the left (off The Totals column will no longer be visible unless you scroll the table all the way to the right.
8. [Save](/simba-embedded-analytics/docs/self-service-analytics/26.3/analyze-data/dashboards/dash-manage#save-a-dashboard) the dashboard.
Modify Pivot Table Rows
**Modify pivot table rows**
1. Edit the pivot table you want to modify. See [Edit Visuals](/simba-embedded-analytics/docs/self-service-analytics/26.3/analyze-data/visuals/visual-setup#edit-visuals).
2. If you are editing the visual in a dashboard, select **Settings** from the [visual drop-down menu](/simba-embedded-analytics/docs/self-service-analytics/26.3/analyze-data/visuals/visual-setup#use-the-visual-drop-down-menu). The [sidebar menu](/simba-embedded-analytics/docs/self-service-analytics/26.3/analyze-data/visuals/visual-setup#use-the-visual-sidebar-menu) for the visual appears.
If you are editing the visual from the Visual Gallery, the sidebar appears to the right of the visual.
3. Select on the [sidebar menu](/simba-embedded-analytics/docs/self-service-analytics/26.3/analyze-data/visuals/visual-setup#use-the-visual-sidebar-menu). The Pivot Table Settings sidebar for the visual appears.
4. To modify the rows in the pivot table:
* Select in the Rows area of the Pivot Table Settings sidebar. The sidebar changes to show all the possible rows for the table.
* Select the rows you want to add and clear the ones you want to remove. If you want to select all the rows, select **Select All**.
Use the search bar to search for a field in the table. Use the buttons under the search bar to limit the fields you see in the list.
| Select | To |
| -------------------------------------------------------------------------------------------------------------------------------------------------------------------------------------------------------------------------------------------------------------------------------------------------------------------------------------------------------------------------------------------------------------------------------------------------------------------------------------------------------------------------------------------------------------------------------------------------------------------------------------------------------------------------------------------------------------------------------------------------------------------------------------------------------------------------------------------------------------------------------------------------------------------------------------------------------------------------------------------------------------------------------------------------------------------------------------------------------------------------------------------------------------------------------------------------------------------------------------------------------------------------------------------------------------------------------------------------------------------------------------------------------------------------------------------------------------------------------------------------------------------------------------------------------------------------------------------------------------------------------------------------------------------------------------------------------------------------------------------------------------------------------------------------------------------------------------------------------------------------------------------------------------------------------------------------------------------------------------------------------------------------------------------------------------- | ----------------------------------------------------------- |
| | See all available fields. |
| | Limit the field list to the available attributes. |
| | Limit the field list to the available numeric metrics. |
| | Limit the field list to the available date and time fields. |
* After all row fields are selected, select **Apply**.
If the field you select is a time field, you can modify its granularity and indicate whether or not blanks (even time intervals) should be included in the time field values.
5. If your pivot table displays a lot of data horizontally, you may need to unfreeze the horizontal scroll bar. By default, this scroll bar is frozen. To unfreeze the horizontal scroll bar, slide the **Freeze Rows** slider in the Rows section of the Pivot Table Settings sidebar to the left (off). The horizontal scroll bar will appear and be useable.
6. Enable or disable **Span Duplicate Rows** to group repeating row groups.
7. Select **Apply** to apply your changes to the pivot table.
8. [Save](/simba-embedded-analytics/docs/self-service-analytics/26.3/analyze-data/dashboards/dash-manage#save-a-dashboard) the dashboard.
Sort Data in a Pivot Table
The data in the table can be sorted. After you save the dashboard or visual, the sort settings are retained when you close it. The sort settings are also retained when you export and share the table.
**Sort the rows in a table by the data in a single column:**
* Select a column to sort the data in ascending order. An up arrow is shown in the heading.
* Select the column again to sort the data in descending order. A down arrow is shown in the heading.
* Select the column again to clear the sort. No arrows are shown in the heading.
* Alternatively, hover over the header and select the table context menu () then select **Reset \[name]** to clear all sorting options.
Save the visual when the data is sorted to your satisfaction.
**Sort the columns in a table:**
* Select a column to sort the data in ascending order. An up arrow is shown in the heading.
* Select the column again to sort the data in descending order. A down arrow is shown in the heading.
* Select the column again to clear the sort. No arrows are shown in the heading.
* Alternatively, hover over the header and select the table context menu () then select **Reset \[name] sorting** to clear all sorting options.
**Sort the data in a table by the data by one or more column or row groups:**
Sort Column groups:
* Select a column group to sort the group from ascending to descending.
* Select the column group again to reverse the sort order, or a third time to cancel sorting.
* To sort by multiple groups, select the next column group to include.
Sort Row groups:
* Select a row group to sort the group from ascending to descending.
* Select the row group again to reverse the sort order, or a third time to cancel sorting.
* To sort by multiple groups, select the next row group to include.
To clear sorting, hover over a column or row label, select the table context menu () and select one of the following options:
* **Reset \[name] sorting** to clear all sorting options for that row or column.
* **Reset other column (or rows) sorting** to clear sorting options for all column or row groups except the one you have selected.
* **Reset all columns (or rows) sorting** to clear all sorting options for all column or row groups.
[Save](/simba-embedded-analytics/docs/self-service-analytics/26.3/analyze-data/dashboards/dash-manage#save-a-dashboard) the dashboard or visual when the data is sorted to your satisfaction.