
> ## Documentation Index
> Fetch the complete documentation index at: https://insightsoftware.mintlify.site/llms.txt
> Use this file to discover all available pages before exploring further.

# Use the Time Bar

> Provides an overview of the time bar.

Self-Service Analytics supports time-based attributes for both live streaming sources (like sources created using upload API) and historical data sets (like SQL-based tables). When time-based attributes are available for a data source, the time bar can be used on a dashboard.

Use the time bar to filter your visuals using a time attribute. It appears at the bottom of your dashboard. The time bar shown depends on the type visual you select. Here is an example time bar, with its parts identified:

<img src="https://mintcdn.com/insightsoftware/GTXU--ZlYc3DodOR/simba-embedded-analytics/docs/self-service-analytics/26.3/images/dashboards/time-bar-layout.png?fit=max&auto=format&n=GTXU--ZlYc3DodOR&q=85&s=8afb381318ecb15fd6eade490bad4362" alt="" width="672" height="99" data-path="simba-embedded-analytics/docs/self-service-analytics/26.3/images/dashboards/time-bar-layout.png" />

Each section is described in the following table:

<table>
  <thead>
    <tr>
      <th>Number</th>
      <th>Image</th>
      <th>Description</th>
    </tr>
  </thead>

  <tbody>
    <tr>
      <td>1</td>

      <td>
        <img src="https://mintcdn.com/insightsoftware/GTXU--ZlYc3DodOR/simba-embedded-analytics/docs/self-service-analytics/26.3/images/dashboards/time-bar-field.png?fit=max&auto=format&n=GTXU--ZlYc3DodOR&q=85&s=91481b7f1a85b9349f3ebecd7b9b94bc" alt="" width="73" height="19" data-path="simba-embedded-analytics/docs/self-service-analytics/26.3/images/dashboards/time-bar-field.png" />
      </td>

      <td>
        Shows the time field selected for the time bar. Use this to change the time field.

        <br />

        See [Change the Time Bar Field](#change-the-time-bar-field).
      </td>
    </tr>

    <tr>
      <td>2</td>

      <td>
        <img src="https://mintcdn.com/insightsoftware/GTXU--ZlYc3DodOR/simba-embedded-analytics/docs/self-service-analytics/26.3/images/dashboards/time-bar-range.png?fit=max&auto=format&n=GTXU--ZlYc3DodOR&q=85&s=8df95ee392122390e0a7f64d985daa91" alt="" width="34" height="29" noZoom style={{display: 'inline', verticalAlign: 'middle', width: '34px', height: '29px', margin: '0 2px'}} data-path="simba-embedded-analytics/docs/self-service-analytics/26.3/images/dashboards/time-bar-range.png" />
      </td>

      <td>
        Allows you to select a static or dynamic time range for the time bar.

        <br />

        See [Adjust the Time Bar Range Using the Time Range Dialog](#adjust-the-time-bar-range-using-the-time-range-dialog).
      </td>
    </tr>

    <tr>
      <td>3</td>

      <td>
        <img src="https://mintcdn.com/insightsoftware/GTXU--ZlYc3DodOR/simba-embedded-analytics/docs/self-service-analytics/26.3/images/dashboards/time-bar-from-slider.png?fit=max&auto=format&n=GTXU--ZlYc3DodOR&q=85&s=e49c19152397dd7e27b59e04beec9951" alt="" width="40" height="45" noZoom style={{display: 'inline', verticalAlign: 'middle', width: '40px', height: '45px', margin: '0 2px'}} data-path="simba-embedded-analytics/docs/self-service-analytics/26.3/images/dashboards/time-bar-from-slider.png" />
      </td>

      <td>
        The From slider. Slide this to the right to change the minimum static time range.

        <br />

        See [Adjust the Time Bar Range Using Time Bar Sliders](#adjust-the-time-bar-range-using-time-bar-sliders).
      </td>
    </tr>

    <tr>
      <td>4</td>

      <td>
        <img src="https://mintcdn.com/insightsoftware/GTXU--ZlYc3DodOR/simba-embedded-analytics/docs/self-service-analytics/26.3/images/dashboards/time-bar-to-slider.png?fit=max&auto=format&n=GTXU--ZlYc3DodOR&q=85&s=4481e9d8875b0f7b686c0503c6b018f9" alt="" width="37" height="31" noZoom style={{display: 'inline', verticalAlign: 'middle', width: '37px', height: '31px', margin: '0 2px'}} data-path="simba-embedded-analytics/docs/self-service-analytics/26.3/images/dashboards/time-bar-to-slider.png" />
      </td>

      <td>
        The To slider. Slide this to the left to change the maximum static time range.

        <br />

        See [Adjust the Time Bar Range Using Time Bar Sliders](#adjust-the-time-bar-range-using-time-bar-sliders).
      </td>
    </tr>

    <tr>
      <td>5</td>

      <td>
        <img src="https://mintcdn.com/insightsoftware/GTXU--ZlYc3DodOR/simba-embedded-analytics/docs/self-service-analytics/26.3/images/dashboards/time-bar-live-mode.png?fit=max&auto=format&n=GTXU--ZlYc3DodOR&q=85&s=d498f46165dc220a35ee80c75d3f64c6" alt="" width="36" height="33" noZoom style={{display: 'inline', verticalAlign: 'middle', width: '36px', height: '33px', margin: '0 2px'}} data-path="simba-embedded-analytics/docs/self-service-analytics/26.3/images/dashboards/time-bar-live-mode.png" />
      </td>

      <td>
        Indicates whether or not live data is [enabled](/simba-embedded-analytics/docs/self-service-analytics/26.3/connect-to-data/sources/data-source-config-global-settings-tab#configure-time-bar-defaults) for the visual's data source.

        <br />

        If **Live** appears here, it is live data is enabled.

        <br />

        If **Max** appears here, live data is not enabled.
      </td>
    </tr>

    <tr>
      <td>6</td>

      <td>
        <img src="https://mintcdn.com/insightsoftware/GTXU--ZlYc3DodOR/simba-embedded-analytics/docs/self-service-analytics/26.3/images/dashboards/time-bar-playback.png?fit=max&auto=format&n=GTXU--ZlYc3DodOR&q=85&s=9dcf1aa08fe37d354a7e144f2395d941" alt="" width="64" height="30" data-path="simba-embedded-analytics/docs/self-service-analytics/26.3/images/dashboards/time-bar-playback.png" />
      </td>

      <td>Allows you to control data playback, if it is [enabled](/simba-embedded-analytics/docs/self-service-analytics/26.3/connect-to-data/sources/data-source-config-global-settings-tab#configure-time-bar-defaults) for the visual's data source.</td>
    </tr>

    <tr>
      <td>7</td>

      <td>
        <img src="https://mintcdn.com/insightsoftware/GTXU--ZlYc3DodOR/simba-embedded-analytics/docs/self-service-analytics/26.3/images/dashboards/time-bar-zoom.png?fit=max&auto=format&n=GTXU--ZlYc3DodOR&q=85&s=c953dd6267ef0752239abe0dfa2b0875" alt="" width="31" height="30" noZoom style={{display: 'inline', verticalAlign: 'middle', width: '31px', height: '30px', margin: '0 2px'}} data-path="simba-embedded-analytics/docs/self-service-analytics/26.3/images/dashboards/time-bar-zoom.png" />
      </td>

      <td>
        When you select this, the time bar zooms to view only the specified range. All other times are not visible.

        <br />

        See [Zoom Into a Time Bar Range](#zoom-into-a-time-bar-range).
      </td>
    </tr>

    <tr>
      <td>8</td>

      <td>
        <img src="https://mintcdn.com/insightsoftware/GTXU--ZlYc3DodOR/simba-embedded-analytics/docs/self-service-analytics/26.3/images/dashboards/time-bar-range-avail.png?fit=max&auto=format&n=GTXU--ZlYc3DodOR&q=85&s=af4de51a381b79b37edb05060aba4c61" alt="" width="31" height="32" noZoom style={{display: 'inline', verticalAlign: 'middle', width: '31px', height: '32px', margin: '0 2px'}} data-path="simba-embedded-analytics/docs/self-service-analytics/26.3/images/dashboards/time-bar-range-avail.png" />
      </td>

      <td>When you select this, the time bar expands to show the available range of times in the data.</td>
    </tr>

    <tr>
      <td>9</td>

      <td>
        <img src="https://mintcdn.com/insightsoftware/GTXU--ZlYc3DodOR/simba-embedded-analytics/docs/self-service-analytics/26.3/images/dashboards/time-bar-select-max.png?fit=max&auto=format&n=GTXU--ZlYc3DodOR&q=85&s=e3cde765534f95960227ac391df265ae" alt="" width="28" height="31" noZoom style={{display: 'inline', verticalAlign: 'middle', width: '28px', height: '31px', margin: '0 2px'}} data-path="simba-embedded-analytics/docs/self-service-analytics/26.3/images/dashboards/time-bar-select-max.png" />
      </td>

      <td>
        When you select this, the maximum range of data is selected. The data shown expands to include all dates and times in the data.

        <br />

        See [Select the Maximum Time Range](#select-the-maximum-time-range).
      </td>
    </tr>
  </tbody>
</table>

You can set time bar settings in data source configurations that will be used, by default, for each new visual created using the data source. See [Configure Time Bar Defaults](/simba-embedded-analytics/docs/self-service-analytics/26.3/connect-to-data/sources/data-source-config-global-settings-tab#configure-time-bar-defaults).

In addition, see the following related topics:

* [Enable the Time Bar for a Visual](#enable-the-time-bar-for-a-visual)
* [Disable the Time Bar for a Visual](#disable-the-time-bar-for-a-visual)
* [Filters and Time Bar Interaction](/simba-embedded-analytics/docs/self-service-analytics/26.3/analyze-data/filters/filters-attr#filters-and-time-bar-interaction)
* [Work with Unified Time Bars](#work-with-unified-time-bars)
* [Live Mode and Historical Playback](#live-mode-and-historical-playback)
* [Even Time Intervals](/simba-embedded-analytics/docs/self-service-analytics/26.3/analyze-data/dashboards/even-time-interval)

<h2 id="use-the-time-bar-sidebar">
  Use the Time Bar Sidebar
</h2>

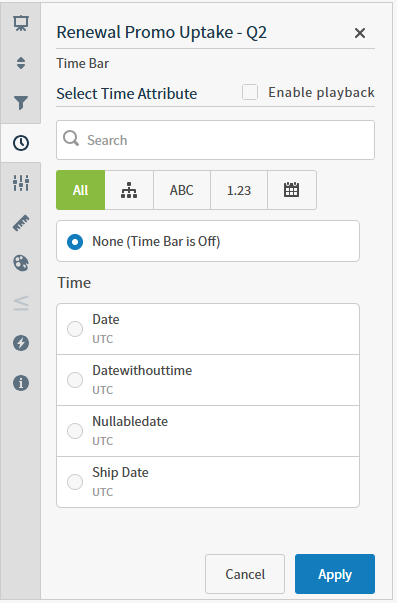
The Time Bar sidebar lets you control some of the time bar settings for a visual. Controls for changing the time bar settings are provided using the interactivity sidebar. See [Control How Users Interact With a Visual](/simba-embedded-analytics/docs/self-service-analytics/26.3/analyze-data/visuals/visual-interactivity).

**Access the Time Bar sidebar for a visual**

1. Select the visual in the Visual Gallery or on a dashboard.

2. If you selected the visual on a dashboard, select **Settings** on the [visual drop-down menu](/simba-embedded-analytics/docs/self-service-analytics/26.3/analyze-data/visuals/visual-setup#use-the-visual-drop-down-menu) to access the [sidebar menu](/simba-embedded-analytics/docs/self-service-analytics/26.3/analyze-data/visuals/visual-setup#use-the-visual-sidebar-menu) for the visual.

3. Select the time bar option (<img src="https://mintcdn.com/insightsoftware/sLccJ1EJ28cO5lT_/simba-embedded-analytics/docs/self-service-analytics/26.3/images/icons/dashboard-schedule.png?fit=max&auto=format&n=sLccJ1EJ28cO5lT_&q=85&s=9e7a1179faaedda7e8026e3ccd40ddcd" alt="select the schedule report icon to schedule a dashboard or report with others" width="18" height="18" noZoom style={{display: 'inline', verticalAlign: 'middle', width: '18px', height: '18px', margin: '0 2px'}} data-path="simba-embedded-analytics/docs/self-service-analytics/26.3/images/icons/dashboard-schedule.png" />) on the [sidebar menu](/simba-embedded-analytics/docs/self-service-analytics/26.3/analyze-data/visuals/visual-setup#use-the-visual-sidebar-menu) for the visual. The Time Bar sidebar opens.
   <img src="https://mintcdn.com/insightsoftware/b9ogX_L4Mqut_Uxb/simba-embedded-analytics/docs/self-service-analytics/26.3/images/v26/work-areas/visuals/time-bar-menu-26-2.png?fit=max&auto=format&n=b9ogX_L4Mqut_Uxb&q=85&s=2baab744184754d9cdaacc8a3ea4efe3" alt="define the time attribute to use in the time bar, turn the time bar off, and enable playback for live data as applicable" width="397" height="603" data-path="simba-embedded-analytics/docs/self-service-analytics/26.3/images/v26/work-areas/visuals/time-bar-menu-26-2.png" />

4. Using the Time Bar sidebar, you can:

   * Enable the time bar. See [Enable the Time Bar for a Visual](#enable-the-time-bar-for-a-visual).
   * Disable the time bar. See [Disable the Time Bar for a Visual](#disable-the-time-bar-for-a-visual).
   * Select or change the time bar field. See [Change the Time Bar Field](#change-the-time-bar-field).
   * Enable playback, if the selected time bar field supports it. See [Live Mode and Historical Playback](#live-mode-and-historical-playback).
   <Note>
     If you are using a field that has time zone information disabled (select **Not Specified**), only the time-related information is shown in the user interface and exported with your data. Time zone labels are not included.
   </Note>

5. After making changes, select **Apply** to apply the time bar changes you have specified.

6. Save the visual or dashboard to save your changes.

<h2 id="enable-the-time-bar-for-a-visual">
  Enable the Time Bar for a Visual
</h2>

**Enable the time bar for a visual**

1. Select the visual in the dashboard or in the Visual Gallery.

2. If you selected the visual on a dashboard, select **Settings** on the [visual drop-down menu](/simba-embedded-analytics/docs/self-service-analytics/26.3/analyze-data/visuals/visual-setup#use-the-visual-drop-down-menu) to access the [sidebar menu](/simba-embedded-analytics/docs/self-service-analytics/26.3/analyze-data/visuals/visual-setup#use-the-visual-sidebar-menu) for the visual.

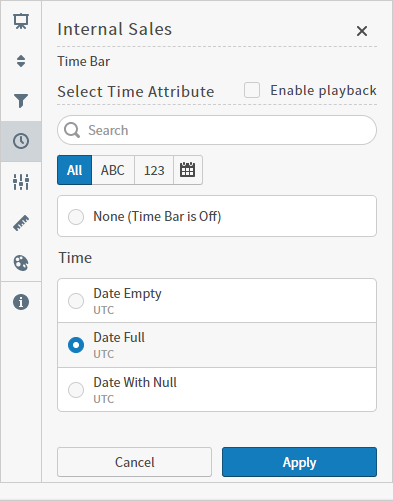
3. Select the visual time bar icon (<img src="https://mintcdn.com/insightsoftware/sLccJ1EJ28cO5lT_/simba-embedded-analytics/docs/self-service-analytics/26.3/images/icons/dashboard-schedule.png?fit=max&auto=format&n=sLccJ1EJ28cO5lT_&q=85&s=9e7a1179faaedda7e8026e3ccd40ddcd" alt="select the schedule report icon to schedule a dashboard or report with others" width="18" height="18" noZoom style={{display: 'inline', verticalAlign: 'middle', width: '18px', height: '18px', margin: '0 2px'}} data-path="simba-embedded-analytics/docs/self-service-analytics/26.3/images/icons/dashboard-schedule.png" />) on the [sidebar menu](/simba-embedded-analytics/docs/self-service-analytics/26.3/analyze-data/visuals/visual-setup#use-the-visual-sidebar-menu) for the visual. The [Time Bar sidebar](/simba-embedded-analytics/docs/self-service-analytics/26.3/analyze-data/visuals/available-visual-types#use-the-re-visualize-sidebar) opens.

   <img src="https://mintcdn.com/insightsoftware/cQU1Auv4yvPMjcip/simba-embedded-analytics/docs/self-service-analytics/26.3/images/visuals/sidebar-timebar-time-select-710.png?fit=max&auto=format&n=cQU1Auv4yvPMjcip&q=85&s=6eeff203a6add82cac1cc2f57074e08c" alt="" width="288" height="367" data-path="simba-embedded-analytics/docs/self-service-analytics/26.3/images/visuals/sidebar-timebar-time-select-710.png" />

4. Select a time attribute on the **Time Bar** sidebar. The **None (Time Bar is Off)** option is not available for the **Line** charts.

5. Optionally, select the **Enable playback** checkbox to enable the **Play/Pause** button (the Data DVR functionality) on the **Time Bar**. You can enable or disable this option in the **Global Default Settings** section for your data source. For more information about the requirements for playback, see [Live Mode and Historical Playback](#live-mode-and-historical-playback).

6. Select **Apply**.

7. [Save](/simba-embedded-analytics/docs/self-service-analytics/26.3/analyze-data/dashboards/dash-manage#save-a-dashboard) the visual or dashboard.

After the time bar is enabled, you can use it for the visual. If the time zone label is disabled (select **[Not Specified](/simba-embedded-analytics/docs/self-service-analytics/26.3/connect-to-data/sources/data-source-config-global-settings-tab#configure-time-bar-defaults)**), time is shown in the local user's time with no time zone information. If additional visuals on the dashboard are create from the same data source, you can use a unified time bar. See [Work with Unified Time Bars](#work-with-unified-time-bars).
<h2 id="disable-the-time-bar-for-a-visual">
  Disable the Time Bar for a Visual
</h2>

**Disable the time bar for a visual**

1. Select the visual in the dashboard or in the Visual Gallery.

2. If you selected the visual on a dashboard, select **Settings** on the [visual drop-down menu](/simba-embedded-analytics/docs/self-service-analytics/26.3/analyze-data/visuals/visual-setup#use-the-visual-drop-down-menu) to access the [sidebar menu](/simba-embedded-analytics/docs/self-service-analytics/26.3/analyze-data/visuals/visual-setup#use-the-visual-sidebar-menu) for the visual.

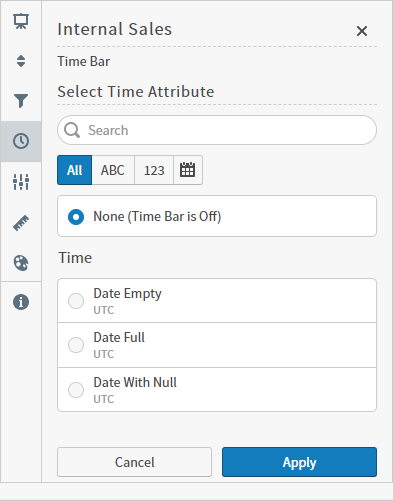
3. Select the visual time bar icon (<img src="https://mintcdn.com/insightsoftware/sLccJ1EJ28cO5lT_/simba-embedded-analytics/docs/self-service-analytics/26.3/images/icons/dashboard-schedule.png?fit=max&auto=format&n=sLccJ1EJ28cO5lT_&q=85&s=9e7a1179faaedda7e8026e3ccd40ddcd" alt="select the schedule report icon to schedule a dashboard or report with others" width="18" height="18" noZoom style={{display: 'inline', verticalAlign: 'middle', width: '18px', height: '18px', margin: '0 2px'}} data-path="simba-embedded-analytics/docs/self-service-analytics/26.3/images/icons/dashboard-schedule.png" />) on the [sidebar menu](/simba-embedded-analytics/docs/self-service-analytics/26.3/analyze-data/visuals/visual-setup#use-the-visual-sidebar-menu) for the visual. The [Time Bar sidebar](/simba-embedded-analytics/docs/self-service-analytics/26.3/analyze-data/visuals/available-visual-types#use-the-re-visualize-sidebar) opens.

   <img src="https://mintcdn.com/insightsoftware/cQU1Auv4yvPMjcip/simba-embedded-analytics/docs/self-service-analytics/26.3/images/visuals/sidebar-timebar-710.png?fit=max&auto=format&n=cQU1Auv4yvPMjcip&q=85&s=770727e289e1bbb399a979f53885868d" alt="" width="288" height="367" data-path="simba-embedded-analytics/docs/self-service-analytics/26.3/images/visuals/sidebar-timebar-710.png" />

4. Select the **None (Time Bar is Off)** option. This option is not available for the **Line** charts.

5. Select **Apply**.

6. [Save](/simba-embedded-analytics/docs/self-service-analytics/26.3/analyze-data/dashboards/dash-manage#save-a-dashboard) the dashboard.

The time bar is disabled for the visual.
<h2 id="change-the-time-bar-field">
  Change the Time Bar Field
</h2>

You can change the time bar field for a visual in the [visual time bar settings](#change-the-time-bar-field-using-visual-settings) or [on the time bar](#change-the-time-bar-field-on-the-time-bar) itself.

While you are working on a dashboard or visual, the time range and playback configuration you have selected for different time fields are retained. So when you switch between different time fields, the time range and playback settings may change. For example, you might have analyzed your data using the following time fields:

| Field | Range                   | Playback       |
| ----- | ----------------------- | -------------- |
| Date  | January 2024-March 2024 | On (enabled)   |
| Ts    | April 2024              | Off (disabled) |

When you switch between these fields on the time bar, the ranges and playback settings also switch, as appropriate for each field.

<h3 id="change-the-time-bar-field-using-visual-settings">
  Change the Time Bar Field Using Visual Settings
</h3>

**Change the time bar field for a visual using the visual time bar settings**

1. Select the visual in the dashboard or in the Visual Gallery.

2. If you selected the visual on a dashboard, select **Settings** on the [visual drop-down menu](/simba-embedded-analytics/docs/self-service-analytics/26.3/analyze-data/visuals/visual-setup#use-the-visual-drop-down-menu) to access the [sidebar menu](/simba-embedded-analytics/docs/self-service-analytics/26.3/analyze-data/visuals/visual-setup#use-the-visual-sidebar-menu) for the visual.

3. Select the visual time bar icon (<img src="https://mintcdn.com/insightsoftware/sLccJ1EJ28cO5lT_/simba-embedded-analytics/docs/self-service-analytics/26.3/images/icons/dashboard-schedule.png?fit=max&auto=format&n=sLccJ1EJ28cO5lT_&q=85&s=9e7a1179faaedda7e8026e3ccd40ddcd" alt="select the schedule report icon to schedule a dashboard or report with others" width="18" height="18" noZoom style={{display: 'inline', verticalAlign: 'middle', width: '18px', height: '18px', margin: '0 2px'}} data-path="simba-embedded-analytics/docs/self-service-analytics/26.3/images/icons/dashboard-schedule.png" />) on the [sidebar menu](/simba-embedded-analytics/docs/self-service-analytics/26.3/analyze-data/visuals/visual-setup#use-the-visual-sidebar-menu) for the visual. The [Time Bar sidebar](/simba-embedded-analytics/docs/self-service-analytics/26.3/analyze-data/visuals/available-visual-types#use-the-re-visualize-sidebar) opens.

4. Select a new time field on the **Time Bar** sidebar. The **None (Time Bar is Off)** option is not available for the **Line** charts.

5. Optionally, select the **Enable playback** checkbox to enable the **Play/Pause** button (the Data DVR functionality) on the **Time Bar**. You can enable or disable this option in the **Global Default Settings** section for your data source. For more information about the requirements for playback, see [Live Mode and Historical Playback](#live-mode-and-historical-playback).

6. Select **Apply**.

   The time bar for the visual is changed. If the visual is using a unified time bar, all the visuals using the unified time bar are also changed. See [Work with Unified Time Bars](#work-with-unified-time-bars).

7. [Save](/simba-embedded-analytics/docs/self-service-analytics/26.3/analyze-data/dashboards/dash-manage#save-a-dashboard) the dashboard or visual.

<h3 id="change-the-time-bar-field-on-the-time-bar">
  Change the Time Bar Field on the Time Bar
</h3>

**Change the time bar field for a visual using the time bar**

1. Select the visual.

2. On the left side of the time bar, select the field name. A Time Bar dialog pops up listing all the time fields in the data source for the visual.

3. Select a new time field on the dialog. The **None (Time Bar is Off)** option is not available for the **Line** charts.

   The time bar for the visual is changed. If the visual is using a unified time bar, all the visuals using the unified time bar are also changed. See [Work with Unified Time Bars](#work-with-unified-time-bars).

4. Close the Time Bar dialog.

5. [Save](/simba-embedded-analytics/docs/self-service-analytics/26.3/analyze-data/dashboards/dash-manage#save-a-dashboard) the dashboard.

<h2 id="adjust-the-time-bar-range">
  Adjust the Time Bar Range
</h2>

You can adjust the time bar range using the time bar range dialog, the From and To sliders, and maximum range selector. You can also zoom into a selected time range.

Except for derived fields, the default range for a time bar field is the maximum range of its values.

The default range for a derived time field is always the current year. Use the [range dialog on the time bar](#adjust-the-time-bar-range-using-the-time-range-dialog) to adjust the range for the derived field to represent the actual data available. For example, if your derived field data is for 2017-2018, the default range will be the current year, which might fall after the actual dates in the data. Using the range dialog on the time bar, you can adjust the range to 2017-2018.

See the following topics:

* [Adjust the Time Bar Range Using the Time Range Dialog](#adjust-the-time-bar-range-using-the-time-range-dialog)
* [Adjust the Time Bar Range Using Time Bar Sliders](#adjust-the-time-bar-range-using-time-bar-sliders)
* [Select the Maximum Time Range](#select-the-maximum-time-range)
* [Zoom Into a Time Bar Range](#zoom-into-a-time-bar-range)

<h2 id="adjust-the-time-bar-range-using-the-time-range-dialog">
  Adjust the Time Bar Range Using the Time Range Dialog
</h2>

**Adjust the time bar time range for a visual using the time range dialog**

1. Select the visual.

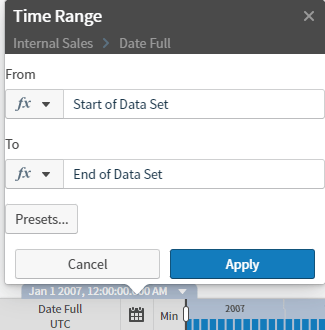
2. Select the range setting icon (<img src="https://mintcdn.com/insightsoftware/GTXU--ZlYc3DodOR/simba-embedded-analytics/docs/self-service-analytics/26.3/images/dashboards/time-bar-range.png?fit=max&auto=format&n=GTXU--ZlYc3DodOR&q=85&s=8df95ee392122390e0a7f64d985daa91" alt="" width="29" height="24" noZoom style={{display: 'inline', verticalAlign: 'middle', width: '29px', height: '24px', margin: '0 2px'}} data-path="simba-embedded-analytics/docs/self-service-analytics/26.3/images/dashboards/time-bar-range.png" />) on the time bar. The Time Range dialog appears.

   <img src="https://mintcdn.com/insightsoftware/GTXU--ZlYc3DodOR/simba-embedded-analytics/docs/self-service-analytics/26.3/images/dashboards/time-range-dialog-710.png?fit=max&auto=format&n=GTXU--ZlYc3DodOR&q=85&s=f55367cae4ce7c90da17c4bf641071dc" alt="" width="325" height="330" data-path="simba-embedded-analytics/docs/self-service-analytics/26.3/images/dashboards/time-range-dialog-710.png" />

3. Use the **From** and **To** boxes to specify the default time bar range.

   You can set the range in static time or dynamic time, or use preset ranges provided with Self-Service Analytics.

   * Select **Static Time** or **Dynamic Time** in the **fx** drop-down menu.
     <img src="https://mintcdn.com/insightsoftware/GTXU--ZlYc3DodOR/simba-embedded-analytics/docs/self-service-analytics/26.3/images/dashboards/time-range-dialog-710.png?fit=max&auto=format&n=GTXU--ZlYc3DodOR&q=85&s=f55367cae4ce7c90da17c4bf641071dc" alt="" width="325" height="330" data-path="simba-embedded-analytics/docs/self-service-analytics/26.3/images/dashboards/time-range-dialog-710.png" />

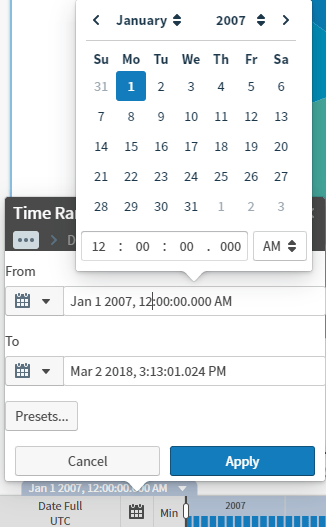
     If you select **Static Time**, the **From** and **To** boxes are filled with default dates and times. Use the boxes to select specific from and to times:

     <img src="https://mintcdn.com/insightsoftware/GTXU--ZlYc3DodOR/simba-embedded-analytics/docs/self-service-analytics/26.3/images/dashboards/time-bar-static-range-710.png?fit=max&auto=format&n=GTXU--ZlYc3DodOR&q=85&s=614cb45822bfab1917ebc7365169858a" alt="" width="326" height="527" data-path="simba-embedded-analytics/docs/self-service-analytics/26.3/images/dashboards/time-bar-static-range-710.png" />

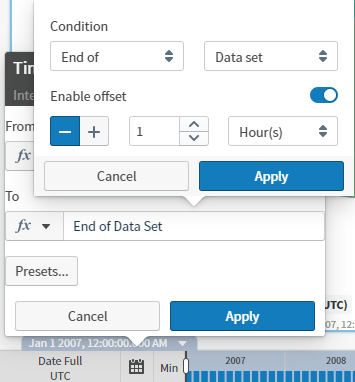
     If you select **Dynamic Time**, the **From** and **To** boxes are filled with **Start of data** and **End of data** automatically. Use the boxes to select different dynamic from and to times:
     <img src="https://mintcdn.com/insightsoftware/GTXU--ZlYc3DodOR/simba-embedded-analytics/docs/self-service-analytics/26.3/images/dashboards/time-bar-dynamic-range-710.png?fit=max&auto=format&n=GTXU--ZlYc3DodOR&q=85&s=9337e850e9ac6e6f4ae212292c6673bd" alt="" width="355" height="382" data-path="simba-embedded-analytics/docs/self-service-analytics/26.3/images/dashboards/time-bar-dynamic-range-710.png" />

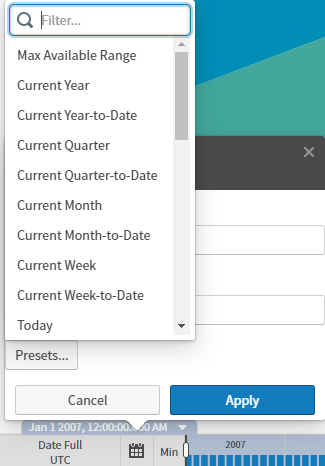
   * Alternatively, select **Presets...** to fill the **From** and **To** boxes with predefined time ranges provided by Self-Service Analytics:
     <img src="https://mintcdn.com/insightsoftware/GTXU--ZlYc3DodOR/simba-embedded-analytics/docs/self-service-analytics/26.3/images/dashboards/time-bar-presets-710.png?fit=max&auto=format&n=GTXU--ZlYc3DodOR&q=85&s=f65a432180d4797ebfe8df9a80f72fbf" alt="" width="325" height="466" data-path="simba-embedded-analytics/docs/self-service-analytics/26.3/images/dashboards/time-bar-presets-710.png" />

     Use the filter box at the top of the presets list to locate the preset setting you want. Descriptions of each of the preset options are provided in [Preset Time Ranges](/simba-embedded-analytics/docs/self-service-analytics/26.3/connect-to-data/data/data-number-formatting#preset-time-ranges).

4. Select **Apply** to apply the new time range setting. It is applied to the visual. If the visual is using a unified time bar, the new time range setting is applied to all the visuals using the unified time bar. See [Work with Unified Time Bars](#work-with-unified-time-bars).

5. Save the dashboard.

<h2 id="adjust-the-time-bar-range-using-time-bar-sliders">
  Adjust the Time Bar Range Using Time Bar Sliders
</h2>

**Adjust the time bar time range for a visual using the time bar sliders**

1. Select the visual.
2. Slide the From slider (<img src="https://mintcdn.com/insightsoftware/GTXU--ZlYc3DodOR/simba-embedded-analytics/docs/self-service-analytics/26.3/images/dashboards/time-bar-from-slider.png?fit=max&auto=format&n=GTXU--ZlYc3DodOR&q=85&s=e49c19152397dd7e27b59e04beec9951" alt="" width="24" height="27" noZoom style={{display: 'inline', verticalAlign: 'middle', width: '24px', height: '27px', margin: '0 2px'}} data-path="simba-embedded-analytics/docs/self-service-analytics/26.3/images/dashboards/time-bar-from-slider.png" />) on the time bar to the earliest time for the time range you want.
3. Slide the To slider (<img src="https://mintcdn.com/insightsoftware/GTXU--ZlYc3DodOR/simba-embedded-analytics/docs/self-service-analytics/26.3/images/dashboards/time-bar-to-slider.png?fit=max&auto=format&n=GTXU--ZlYc3DodOR&q=85&s=4481e9d8875b0f7b686c0503c6b018f9" alt="" width="22" height="18" noZoom style={{display: 'inline', verticalAlign: 'middle', width: '22px', height: '18px', margin: '0 2px'}} data-path="simba-embedded-analytics/docs/self-service-analytics/26.3/images/dashboards/time-bar-to-slider.png" />) on the time bar to the latest time for the time range you want.
4. Save the dashboard.

To select the maximum range of values, select <img src="https://mintcdn.com/insightsoftware/GTXU--ZlYc3DodOR/simba-embedded-analytics/docs/self-service-analytics/26.3/images/dashboards/time-bar-select-max.png?fit=max&auto=format&n=GTXU--ZlYc3DodOR&q=85&s=e3cde765534f95960227ac391df265ae" alt="" width="21" height="23" noZoom style={{display: 'inline', verticalAlign: 'middle', width: '21px', height: '23px', margin: '0 2px'}} data-path="simba-embedded-analytics/docs/self-service-analytics/26.3/images/dashboards/time-bar-select-max.png" /> on the time bar.

<h2 id="zoom-into-a-time-bar-range">
  Zoom Into a Time Bar Range
</h2>

**Zoom into a time bar range**

1. Select a visual on the dashboard.

2. Select a time range for the time bar. See [Adjust the Time Bar Range](#adjust-the-time-bar-range).

3. Select zoom tool icon <img src="https://mintcdn.com/insightsoftware/GTXU--ZlYc3DodOR/simba-embedded-analytics/docs/self-service-analytics/26.3/images/dashboards/time-bar-zoom.png?fit=max&auto=format&n=GTXU--ZlYc3DodOR&q=85&s=c953dd6267ef0752239abe0dfa2b0875" alt="" width="31" height="30" noZoom style={{display: 'inline', verticalAlign: 'middle', width: '31px', height: '30px', margin: '0 2px'}} data-path="simba-embedded-analytics/docs/self-service-analytics/26.3/images/dashboards/time-bar-zoom.png" /> on the right side of the time bar to zoom into the selected range. Only the times for the time range you selected are shown on the time bar.

   To view all the available times in the data, select the all icon <img src="https://mintcdn.com/insightsoftware/GTXU--ZlYc3DodOR/simba-embedded-analytics/docs/self-service-analytics/26.3/images/dashboards/time-bar-range-avail.png?fit=max&auto=format&n=GTXU--ZlYc3DodOR&q=85&s=af4de51a381b79b37edb05060aba4c61" alt="" width="25" height="25" noZoom style={{display: 'inline', verticalAlign: 'middle', width: '25px', height: '25px', margin: '0 2px'}} data-path="simba-embedded-analytics/docs/self-service-analytics/26.3/images/dashboards/time-bar-range-avail.png" /> on the time bar. To select the maximum range of values, select the maximize icon <img src="https://mintcdn.com/insightsoftware/GTXU--ZlYc3DodOR/simba-embedded-analytics/docs/self-service-analytics/26.3/images/dashboards/time-bar-select-max.png?fit=max&auto=format&n=GTXU--ZlYc3DodOR&q=85&s=e3cde765534f95960227ac391df265ae" alt="" width="21" height="23" noZoom style={{display: 'inline', verticalAlign: 'middle', width: '21px', height: '23px', margin: '0 2px'}} data-path="simba-embedded-analytics/docs/self-service-analytics/26.3/images/dashboards/time-bar-select-max.png" /> on the time bar.

4. Save the dashboard.

<h2 id="select-the-maximum-time-range">
  Select the Maximum Time Range
</h2>

**Select the maximum time range on the time bar**

1. Select the visual.
2. Select <img src="https://mintcdn.com/insightsoftware/GTXU--ZlYc3DodOR/simba-embedded-analytics/docs/self-service-analytics/26.3/images/dashboards/time-bar-select-max.png?fit=max&auto=format&n=GTXU--ZlYc3DodOR&q=85&s=e3cde765534f95960227ac391df265ae" alt="" width="22" height="24" noZoom style={{display: 'inline', verticalAlign: 'middle', width: '22px', height: '24px', margin: '0 2px'}} data-path="simba-embedded-analytics/docs/self-service-analytics/26.3/images/dashboards/time-bar-select-max.png" /> on the right side of the time bar to select the maximum time range on the time bar.
3. Save the dashboard.

<h2 id="work-with-unified-time-bars">
  Work with Unified Time Bars
</h2>

When you work with your dashboard, you can apply the settings that you have configured on your time bar to multiple visuals from the same data source. This enables you to view and playback the data on different visuals for the same time period and filtered by the same time filter. The time bar shared by the visuals is called a unified time bar.

<Note>
  You can only use a unified time bar for visuals for which the time bar has been enabled.
</Note>

By default, new visuals from the same data source are applied to the same unified time bar on a dashboard, provided the dashboard has only one time bar configured for visuals using that data source. If the existing visuals on the dashboard use different time bars, new visuals are not assigned to the unified time bar and must be configured manually to do so.

### Apply a Unified Time Bar to Multiple Visuals

If you have several visuals from the same data source or your visuals contain [cross-source links](/simba-embedded-analytics/docs/self-service-analytics/26.3/analyze-data/filters/using-cross-source-links), you can use different time bar settings for different visuals.

**Apply a unified time bar to multiple visuals that use the same data source on your dashboard**

1. Select a visual on the dashboard and configure the time bar settings, as described above.

2. Select the time attribute on the left side of the time bar. The Time Bar dialog appears.

   <Note>
     If you are using a field that has time zone information disabled (select **Not Specified**), only the time-related information is shown in the user interface and exported with your data. Time zone labels are not included.
   </Note>

3. In the Time Bar dialog, select the visuals from your dashboard you want to use a unified time bar. The available visuals are listed in the **Applies to** section. The visuals selected will share a unified time bar. The unselected visuals will maintain their own individual time bars.

   <Note>
     If your dashboard contains visuals from different data sources, the **Applies to** section lists the visuals separated by data source. The active section in the **Applies to** list depends on the visual selected in the dashboard.
   </Note>

4. Save the dashboard.

### Change the Unified Time Bar Attribute

**Change the unified time bar attribute**

1. Select a visual on the dashboard that is using the time bar.

2. Select the time attribute on the left side of the time bar. The Time Bar dialog appears.

3. In the Time Bar dialog, select a different time attribute. all the visuals using the unified time bar will adjust to use the new time attribute.

   <Note>
     If your dashboard contains visuals from different data sources, the **Applies to** section lists the visuals separated by data source. The active section in the **Applies to** list depends on the visual selected in the dashboard.
   </Note>

4. Save the dashboard.

### Change the Unified Time Bar Range

**Change the unified time bar range**

1. Select a visual on the dashboard that is using the time bar.

2. Do one of the following:

   * Select the range setting on the time bar and select a new static time range, dynamic time range, or preset time range for the time bar. See [Adjust the Time Bar Range](#adjust-the-time-bar-range).
   * Use the time bar sliders to adjust the range.

3. Save the dashboard.

### Remove a Visual from the Unified Time Bar

**Remove a visual from a unified time bar**

1. Select the visual on the dashboard.

2. Select the time attribute on the left side of the time bar. The Time Bar dialog appears.

3. In the Time Bar dialog, clear the checkbox associated with the visual in the **Applies to** section. The visual will no longer share the unified time bar.

   <Note>
     If your dashboard contains visuals from different data sources, the **Applies to** section lists the visuals separated by data source. The active section in the **Applies to** list depends on the visual selected in the dashboard.
   </Note>

4. Save the dashboard.

For example, suppose you need to filter the data in the ***Sales by Hour*** visual by the ***Inserted*** attribute for ***JAN 10 2017 6 AM*** on the ***Real Time Sales*** visual. When you select **Apply** to apply the filter, you will have to confirm breaking the unification. The ***Real Time Sales*** visual is updated and the time bar changes accordingly.

<h2 id="live-mode-and-historical-playback">
  Live Mode and Historical Playback
</h2>

Live mode and historical playback (also known as Data DVR) allow you to get the most from data stores that support playback. The only difference between live mode and historical playback is the time range that is selected.

* Live mode refreshes field data on your visuals for date-time fields that are indexed as playable. In live mode, your data plays forever without an end date.
* Historical playback (Data DVR) shows the historical record of field data for date-time fields that are indexed as playable. Playback can show up to the last moment before the current period in your data.

Live mode and historical playback require:

* A date-time field in your data store (data base) that is either indexed or partitioned.

  If indexed, the index should be non-clustered.

  If your data store does not support indexing or partitioning, then live mode and historical playback are not available for that data. For most data stores, indexing is the default.

* The time zone used by the date-time field in the data source should align with the time zone used by the date-time field in your data store. The data source time zone can be set using the **Time Zone** attribute on the [Fields tab](/simba-embedded-analytics/docs/self-service-analytics/26.3/connect-to-data/sources/data-source-config-fields-tab) of the data source definition.

* The data source should have live mode enabled. Use the **Live Mode** switch on the Global Settings tab of the data source configuration. See [Configure Time Bar Defaults](/simba-embedded-analytics/docs/self-service-analytics/26.3/connect-to-data/sources/data-source-config-global-settings-tab#configure-time-bar-defaults).

* The data store should be capable of receiving new or updated data, that is, data that is not static like flat files.

Live mode and historical playback are supported for even time intervals. See [Even Time Intervals](/simba-embedded-analytics/docs/self-service-analytics/26.3/analyze-data/dashboards/even-time-interval). Live mode and historical playback are not supported for fused data sources. See [Data Fusion Limitations](/simba-embedded-analytics/docs/self-service-analytics/26.3/connect-to-data/sources/data-fusion-overview#data-fusion-limitations).

<Note>
  Live mode and historical playback do not work for tables when the table is grouped. See [Group and Ungroup Table Data](/simba-embedded-analytics/docs/self-service-analytics/26.3/analyze-data/visuals/rdt#group-and-ungroup-table-data).
</Note>

Playback mode (Data DVR) is available if the date-time field in your data source has the **playable** property set to **True** and the granularity of the field is not greater than **day**. When is the **playable** property in a data source set to true?

1. If the date-time field in the data store is indexed or partitioned. For Impala data stores, this option can also be enabled if the selected date field has a connection to the partitioned date field.
2. If the data store is Spark (for example, Spark SQL).
3. In Amazon Redshift, data sources for the first sort key.

Support for this feature by connector is shown in the following table.

<strong>Key:</strong>**Y** - Supported; **N** - Not Supported; N/A - not applicable

| Connector                                                                                                                                              | Supported?       |
| ------------------------------------------------------------------------------------------------------------------------------------------------------ | ---------------- |
| [Amazon Redshift](/simba-embedded-analytics/docs/self-service-analytics/26.3/connect-to-data/connectors/connecting-to-amazon-redshift)                 | **Y**            |
| [Amazon S3](/simba-embedded-analytics/docs/self-service-analytics/26.3/connect-to-data/connectors/connecting-to-amazon-s3)                             | **Y**            |
| [Apache Drill](/simba-embedded-analytics/docs/self-service-analytics/26.3/connect-to-data/connectors/connecting-to-apache-drill)                       | **Y**            |
| [Apache Phoenix](/simba-embedded-analytics/docs/self-service-analytics/26.3/connect-to-data/connectors/connecting-to-apache-phoenix)                   | **N**            |
| [Apache Phoenix Query Server (QS)](/simba-embedded-analytics/docs/self-service-analytics/26.3/connect-to-data/connectors/connecting-to-apache-phoenix) | **N**            |
| [Apache Solr](/simba-embedded-analytics/docs/self-service-analytics/26.3/connect-to-data/connectors/connecting-to-solr)                                | **N**            |
| [BigQuery](/simba-embedded-analytics/docs/self-service-analytics/26.3/connect-to-data/connectors/connecting-to-bigquery)                               | **Y**            |
| [Business Central Jet](/simba-embedded-analytics/docs/self-service-analytics/26.3/connect-to-data/connectors/connect-to-biz-central)                   | **N**            |
| [Cloudera Impala](/simba-embedded-analytics/docs/self-service-analytics/26.3/connect-to-data/connectors/cloudera-ov#manage-the-impala-connector)       | **Y**            |
| [Cloudera Search](/simba-embedded-analytics/docs/self-service-analytics/26.3/connect-to-data/connectors/cloudera-search)                               | **N**            |
| [Couchbase](/simba-embedded-analytics/docs/self-service-analytics/26.3/connect-to-data/connectors/couchbase)                                           | **N**            |
| [Dremio](/simba-embedded-analytics/docs/self-service-analytics/26.3/connect-to-data/connectors/connecting-to-dremio)                                   | **Y**            |
| [Dundas BI (Managed)](/simba-embedded-analytics/docs/self-service-analytics/26.3/connect-to-data/connectors/dbi)                                       | source-dependent |
| [Elasticsearch 7.0](/simba-embedded-analytics/docs/self-service-analytics/26.3/connect-to-data/connectors/connecting-to-elastic-search)                | **Y**            |
| [Elasticsearch 8.0](/simba-embedded-analytics/docs/self-service-analytics/26.3/connect-to-data/connectors/connecting-to-elastic-search)                | **Y**            |
| [File Upload (Upload API)](/simba-embedded-analytics/docs/self-service-analytics/26.3/connect-to-data/connectors/uploading-a-flat-file)                | **Y**            |
| [HDFS](/simba-embedded-analytics/docs/self-service-analytics/26.3/connect-to-data/connectors/hdfs)                                                     | **Y**            |
| [Hive](/simba-embedded-analytics/docs/self-service-analytics/26.3/connect-to-data/connectors/hive)                                                     | **Y**            |
| [Jira](/simba-embedded-analytics/docs/self-service-analytics/26.3/connect-to-data/connectors/connecting-to-jira)                                       | **Y**            |
| [MemSQL](/simba-embedded-analytics/docs/self-service-analytics/26.3/connect-to-data/connectors/connecting-to-memsql)                                   | **Y**            |
| [Microsoft SQL Server](/simba-embedded-analytics/docs/self-service-analytics/26.3/connect-to-data/connectors/connecting-to-sql-server)                 | **Y**            |
| [MongoDB](/simba-embedded-analytics/docs/self-service-analytics/26.3/connect-to-data/connectors/connecting-to-mongodb)                                 | **N**            |
| [MySQL](/simba-embedded-analytics/docs/self-service-analytics/26.3/connect-to-data/connectors/connecting-to-mysql)                                     | **Y**            |
| [OpenSearch](/simba-embedded-analytics/docs/self-service-analytics/26.3/connect-to-data/connectors/connecting-to-opensearch)                           | **Y**            |
| [Oracle](/simba-embedded-analytics/docs/self-service-analytics/26.3/connect-to-data/connectors/connecting-to-oracle)                                   | **Y**            |
| [PostgreSQL](/simba-embedded-analytics/docs/self-service-analytics/26.3/connect-to-data/connectors/connecting-to-postgresql)                           | **Y**            |
| [Python](/simba-embedded-analytics/docs/self-service-analytics/26.3/connect-to-data/connectors/connecting-to-python)                                   | **N**            |
| [Real Time Sales](/simba-embedded-analytics/docs/self-service-analytics/26.3/connect-to-data/connectors/enabling-real-time-sales-demo-source)          | **Y**            |
| [Salesforce](/simba-embedded-analytics/docs/self-service-analytics/26.3/connect-to-data/connectors/connecting-to-salesforce)                           | **Y**            |
| [SAP Hana](/simba-embedded-analytics/docs/self-service-analytics/26.3/connect-to-data/connectors/connecting-to-sap-hana)                               | **Y**            |
| [SAP S/4HANA](/simba-embedded-analytics/docs/self-service-analytics/26.3/connect-to-data/connectors/connecting-to-saps-4hana)                          | **Y**            |
| [SAP IQ](/simba-embedded-analytics/docs/self-service-analytics/26.3/connect-to-data/connectors/connecting-to-sap-iqsql)                                | **Y**            |
| [Spark SQL](/simba-embedded-analytics/docs/self-service-analytics/26.3/connect-to-data/connectors/connecting-to-sparksql)                              | **Y**            |
| [Snowflake](/simba-embedded-analytics/docs/self-service-analytics/26.3/connect-to-data/connectors/connecting-to-snowflake)                             | **Y**            |
| [Teradata](/simba-embedded-analytics/docs/self-service-analytics/26.3/connect-to-data/connectors/connecting-to-teradata)                               | **Y**            |
| [TIBCO DV](/simba-embedded-analytics/docs/self-service-analytics/26.3/connect-to-data/connectors/tibcodv)                                              | **Y**            |
| [Trino](/simba-embedded-analytics/docs/self-service-analytics/26.3/connect-to-data/connectors/connecting-to-trino)                                     | **Y**            |
| [File Upload (Upload API)](/simba-embedded-analytics/docs/self-service-analytics/26.3/connect-to-data/connectors/uploading-a-flat-file)                | **Y**            |
| [Vertica](/simba-embedded-analytics/docs/self-service-analytics/26.3/connect-to-data/connectors/connecting-to-vertica)                                 | **Y**            |

See also [Configure Time Bar Defaults](/simba-embedded-analytics/docs/self-service-analytics/26.3/connect-to-data/sources/data-source-config-global-settings-tab#configure-time-bar-defaults).
