> ## Documentation Index
> Fetch the complete documentation index at: https://insightsoftware.mintlify.site/llms.txt
> Use this file to discover all available pages before exploring further.

# Control How Cross-Visual Filters Interact in a Dashboard

> You can control how visuals interact in a dashboard. You can control the filters, same-source links, and cross-source links that a visual publishes (makes available) for use by other dashboard visuals. You can also control which dashboard filters and links the visual uses (subscribes to).

You can control how cross-visual filters interact in a dashboard. Cross-visual filters are filters created using same-source and cross-source link fields established in the dashboard. You can control which same-source and cross-source link fields each dashboard visual can publish (apply cross-visual filters for) and which links each dashboard visual subscribes to (which cross-visual filters can be applied to the visual).

<Note>
  When more than one dashboard is embedded in an application, the cross-visual filters that are published for a visual on one of the dashboards can be subscribed to by any visual on any of the embedded dashboards. However, this is not true unless the dashboards are embedded in the same application. Visuals in a dashboard open in one window or tab cannot subscribe to cross-visual filters published by visuals in a different window or tab.
</Note>

Using the **Cross-Visual Filtering** tab of the Dashboard Interactions dialog, you can specify which links each dashboard visual publishes and which each visual subscribes to.

* When a visual publishes a link, that visual can apply cross-visual filters using the link field to other dashboard visuals that have subscribed to the link. Cross-visual filters can only be applied if the associated link is published. In addition, they can only be applied using the **Filter** option on the [context menu](/simba-embedded-analytics/docs/self-service-analytics/26.3/analyze-data/visuals/visual-interactivity#use-the-context-menu).
* When a visual subscribes to a link, the visual will be filtered by the link field if another visual creates a cross-visual filter for the same field.

Custom cross-visual filters can also be created in your Javascript code. See [Publish Custom Cross-Visual Filters](/simba-embedded-analytics/docs/self-service-analytics/26.3/analyze-data/filters/published-enable#publish-custom-cross-visual-filters).

Dashboard links are created for a dashboard in two ways:

* Each visual in a dashboard automatically creates *same-source links* for each field (column) in the data source that it uses. Same-source link names have the format: `<source-name>.<field-name>`.

  When a visual is added to a dashboard, its same-source links are created and the links are published. In addition, the visual is automatically subscribed to its own same-source links.

* You can create *cross-source links* for common fields in different data sources used on the same dashboard. See [Use Cross-Source Links](/simba-embedded-analytics/docs/self-service-analytics/26.3/analyze-data/filters/using-cross-source-links). These links can also be published and subscribed in a dashboard.

See the following topics:

* [Understand the Cross-Visual Filtering Tab](#understand-the-cross-visual-filtering-tab)
* [Publish a Link](/simba-embedded-analytics/docs/self-service-analytics/26.3/analyze-data/filters/published-enable)
* [Mute a Published Link](/simba-embedded-analytics/docs/self-service-analytics/26.3/analyze-data/filters/published-enable#mute-a-published-link)
* [Revoke a Published Link](/simba-embedded-analytics/docs/self-service-analytics/26.3/analyze-data/filters/published-enable#revoke-a-published-link)
* [Subscribe a Visual to a Link](/simba-embedded-analytics/docs/self-service-analytics/26.3/analyze-data/filters/published-enable#subscribe-a-visual-to-a-link)
* [Mute a Subscribed Link for a Visual](/simba-embedded-analytics/docs/self-service-analytics/26.3/analyze-data/filters/published-enable#mute-a-subscribed-link-for-a-visual)
* [Specify Cross-Visual Filters for Cross-Visual Links](#specify-cross-visual-filters-for-cross-visual-links)
* [Publish Custom Cross-Visual Filters](/simba-embedded-analytics/docs/self-service-analytics/26.3/analyze-data/filters/published-enable#publish-custom-cross-visual-filters)
* [Subscribe to a Cross-Visual Filter](/simba-embedded-analytics/docs/self-service-analytics/26.3/analyze-data/filters/published-enable#subscribe-to-a-cross-visual-filter)
* [Date-Time Formats in Cross-Visual Filters](#date-time-formats-in-cross-visual-filters)
* [Embed Cross-Visual Link Publish and Subscribe Settings Using JavaScript](/simba-embedded-analytics/docs/self-service-analytics/26.3/embed-and-extend/embed/pubsub-embed)
* [Custom Chart Support for Cross-Visual Links and Filters](/simba-embedded-analytics/docs/self-service-analytics/26.3/analyze-data/filters/published-enable#custom-chart-support-for-cross-visual-links-and-filters)

<h2 id="understand-the-cross-visual-filtering-tab">
  Understand the Cross-Visual Filtering Tab
</h2>

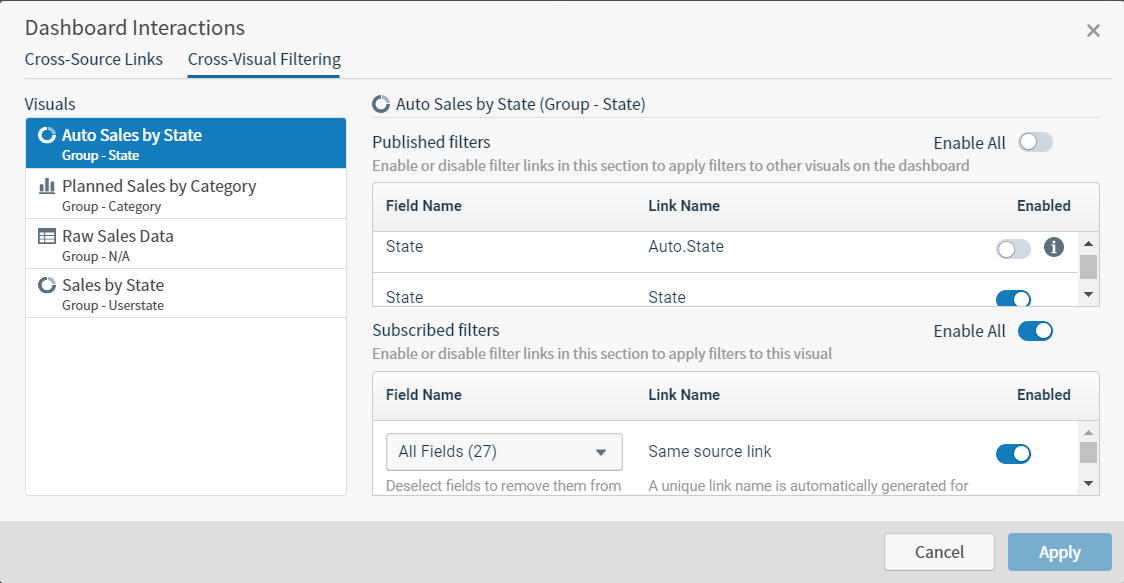
The **Cross-Visual Filtering** tab of the Dashboard Interactions dialog allows you to specify which same-source and cross-source links each dashboard visual publishes and which each visual subscribes to. The Dashboard Interactions dialog can be accessed by selecting <img src="https://mintcdn.com/insightsoftware/2cXq_sDOxrDVXUcv/simba-embedded-analytics/docs/self-service-analytics/26.3/images/dashboards/dash-xsourcelink.png?fit=max&auto=format&n=2cXq_sDOxrDVXUcv&q=85&s=a0bac4bcf53aa484043898173bc91e9b" alt="select to manage cross source links in your environment" width="23" height="22" noZoom style={{display: 'inline', verticalAlign: 'middle', width: '23px', height: '22px', margin: '0 2px'}} data-path="simba-embedded-analytics/docs/self-service-analytics/26.3/images/dashboards/dash-xsourcelink.png" /> on the [dashboard icon bar](/simba-embedded-analytics/docs/self-service-analytics/26.3/analyze-data/dashboards/dash-layout#use-the-dashboard-icons) and then selecting the **Cross-Visual Filtering** tab.

* When a visual publishes a link, that visual can apply cross-visual filters using the link field to other dashboard visuals that have subscribed to the link. Cross-visual filters can only be applied if the associated link is published. In addition, they can only be applied using the **Filter** option on the [context menu](/simba-embedded-analytics/docs/self-service-analytics/26.3/analyze-data/visuals/visual-interactivity#use-the-context-menu).
* When a visual subscribes to a link, the visual will be filtered by the link field if another visual creates a cross-visual filter for the same field.
<img src="https://mintcdn.com/insightsoftware/2cXq_sDOxrDVXUcv/simba-embedded-analytics/docs/self-service-analytics/26.3/images/dashboards/cross-visfilt.png?fit=max&auto=format&n=2cXq_sDOxrDVXUcv&q=85&s=bfa13b0e4b9e9b8bd92a5bd6d25ae825" alt="" width="1124" height="583" data-path="simba-embedded-analytics/docs/self-service-analytics/26.3/images/dashboards/cross-visfilt.png" />

On the left side of this tab, the visuals on the dashboard are listed. The right side of the dashboard is split into two sections: **Published filters** and **Subscribed filters**. You can alter the publish and subscribe settings for each visual in the dashboard. When you select a visual in the **Visuals** list on the left, the published and subscribed filters for the selected visual appear on the right.

The fields on the right side of the tab are described in the following table.

<table>
  <thead>
    <tr>
      <th>Field</th>
      <th>Description</th>
    </tr>
  </thead>

  <tbody>
    <tr>
      <td>Enable All (toggle)</td>

      <td>
        This switch appears at the top of the **Published filters** and **Subscribed filters** sections of the tab. It allows you to quickly enable or mute (disable) all of the automatic filtering listed in those sections.

        <br />

        In the **Published filters** table, when **Enable All** is on (slid to the right), all of the filters associated with the link fields are published for use by other visuals in the dashboard.

        <br />

        In the **Subscribed filters** section, when **Enable All** is on, all of the links are enabled for the visual. When it is off, all of the links are disabled for the visual, although they can be individually switched on.
      </td>
    </tr>

    <tr>
      <td>Field Name</td>
      <td>This column shows the field name associated with each link.</td>
    </tr>

    <tr>
      <td>Link Name</td>

      <td>
        This column shows the same-source and cross-source link names. Same-source link names have the format: `<source-name>.<field-name>`.

        <br />

        Cross-source link names do not have the same format as same-source links, but are defined when the cross-source link definition is created.

        <br />

        See [Define Cross-Source Links](/simba-embedded-analytics/docs/self-service-analytics/26.3/analyze-data/filters/using-cross-source-links#define-cross-source-links).
      </td>
    </tr>

    <tr>
      <td>Enabled column</td>

      <td>
        This column allows you to enable or mute (disable) a specific published or subscribed filter.

        <br />

        To enable a filter, slide the switch on (to the right). To mute a filter, slide the switch off (to the left).
      </td>
    </tr>
  </tbody>
</table>

For more information, see these topics:

* [Publish a Link](/simba-embedded-analytics/docs/self-service-analytics/26.3/analyze-data/filters/published-enable)
* [Mute a Published Link](/simba-embedded-analytics/docs/self-service-analytics/26.3/analyze-data/filters/published-enable#mute-a-published-link)
* [Subscribe a Visual to a Link](/simba-embedded-analytics/docs/self-service-analytics/26.3/analyze-data/filters/published-enable#subscribe-a-visual-to-a-link)
* [Mute a Subscribed Link for a Visual](/simba-embedded-analytics/docs/self-service-analytics/26.3/analyze-data/filters/published-enable#mute-a-subscribed-link-for-a-visual)

<h2 id="specify-cross-visual-filters-for-cross-visual-links">
  Specify Cross-Visual Filters for Cross-Visual Links
</h2>

Filters can be applied across visuals for both same-source and cross-source links. As long as a visual is subscribed to a particular published link field, any filters applied for that link field will be applied to the visual. For example, if Visuals A and B are both subscribed to the link for field Z, and you use the context menu to apply a filter for field Z on Visual B, the filter will also be applied to Visual A.

Filters for cross-source and same-source links are called *cross-visual filters* and are listed in the [Filters sidebar](/simba-embedded-analytics/docs/self-service-analytics/26.3/analyze-data/filters/filters#the-filters-sidebar) separately from filters that are applied from the Filters sidebar.

Cross-visual filters are not saved with the visual, unlike row-level filters.

<Note>
  Filters for cross-source and same-source links must be defined using the [context menu](/simba-embedded-analytics/docs/self-service-analytics/26.3/analyze-data/visuals/visual-interactivity#use-the-context-menu). You cannot create a link filter from the [Filters sidebar](/simba-embedded-analytics/docs/self-service-analytics/26.3/analyze-data/filters/filters#the-filters-sidebar). Filters created from the sidebar apply only to the selected visual.
</Note>

See [Apply a Filter to Dashboard Visuals Using the Context Menu](/simba-embedded-analytics/docs/self-service-analytics/26.3/analyze-data/filters/filters-attr#apply-a-filter-to-dashboard-visuals-using-the-context-menu).

<h2 id="date-time-formats-in-cross-visual-filters">
  Date-Time Formats in Cross-Visual Filters
</h2>

When you specify a date-time field in a cross-visual filter, the data must be in a specific format: `MMM DD YYYY, HH:MM:SS.sss`, where:

<table>
  <tbody>
    <tr>
      <td>`MMM`</td>
      <td>Represents the three-character month of the year (JAN, FEB, MAR, APR, MAY, JUN, JUL, AUG, SEP, OCT, NOV, or DEC).</td>
    </tr>

    <tr>
      <td>`DD`</td>
      <td>Represents the two-digit day of the month (01 through 31).</td>
    </tr>

    <tr>
      <td>`YYYY`</td>
      <td>Represents the four-digit year (for example, 2024).</td>
    </tr>

    <tr>
      <td>`HH`</td>
      <td>Represents the two-digit hour of the day (00 through 23)</td>
    </tr>

    <tr>
      <td>`MM`</td>
      <td>Represents the two-digit minute of the hour (00 through 59)</td>
    </tr>

    <tr>
      <td>`SS`</td>
      <td>Represents the two-digit second of the minute (00 through 59)</td>
    </tr>

    <tr>
      <td>`sss`</td>
      <td>Represents the hundredths of a second (000 through 999)</td>
    </tr>
  </tbody>
</table>

If the data for your date-time fields is not in this format, it must be converted in the Javascript code of your embedding application.

The following example converts date data in the format `MM/DD/YYYY` to the required `MMM DD YYYY, HH:MM:SS.sss` format. Because no hour of the day is provided in the data, the conversion ensures that full days are used (00:00:00.000 through 23:59:59.999).

```javascript theme={null}
const formatDate = (date) => {
    const d = new Date(date);
  const year = '${d.getFullYear()}';
    let month = '${d.getMonth() + 1}';
  let day = '${d.getDate()}';

    if (month.length < 2) {
      month = '0${month}';
    }
    if (day.length < 2) {
      day = '0${day}';
    }

    return '${year}-${month}-${day}';
}

const getEndOfDayString = dateString => '${dateString} 23:59:59.999';
const getStartOfDayString = dateString => '${dateString} 00:00:00.000';
```

<h2 id="use-cross-visual-links-for-cross-visual-filtering">
  Use Cross-Visual Links for Cross-Visual Filtering
</h2>

After you have defined cross-source or same-source links for a dashboard, you can use them in cross-visual filtering. Cross-visual filtering allows you to simultaneously apply the same filter across all visuals in your dashboard that use the linked fields. Cross-visual filters must be applied from a visual's context menu or from the time bar.

<Note>
  Unlike row-level filters, cross-visual filters are not saved with the visual.
</Note>

Cross-source link must be defined on a dashboard before you can use them in cross-visual filtering. However, same-source links are created automatically and can be automatically used in cross-visual filtering. In addition, cross-visual filters are only applied to a dashboard visual if the visual subscribes to its associated cross-visual link. See [Define Cross-Source Links](/simba-embedded-analytics/docs/self-service-analytics/26.3/analyze-data/filters/using-cross-source-links#define-cross-source-links), [Publish a Link](/simba-embedded-analytics/docs/self-service-analytics/26.3/analyze-data/filters/published-enable), and [Subscribe a Visual to a Link](/simba-embedded-analytics/docs/self-service-analytics/26.3/analyze-data/filters/published-enable#subscribe-a-visual-to-a-link).

This section includes the following topics.

* [Apply Cross-Visual Filtering to Dashboard Visuals](#apply-cross-visual-filtering-to-dashboard-visuals)
* [Apply Cross-Visual Filtering From the Time Bar](#apply-cross-visual-filtering-from-the-time-bar)

To view the filters applied to a visual, see [Viewing the Applied Filters for a Visual or Filter Snippet](/simba-embedded-analytics/docs/self-service-analytics/26.3/analyze-data/filters/filters#viewing-the-applied-filters-for-a-visual-or-filter-snippet).

<h3 id="apply-cross-visual-filtering-to-dashboard-visuals">
  Apply Cross-Visual Filtering to Dashboard Visuals
</h3>

**Apply a cross-visual filter from a visual to the dashboard visuals**

1. After cross-visual links are created, select an area of the visual that uses a linked field. The [context menu](/simba-embedded-analytics/docs/self-service-analytics/26.3/analyze-data/visuals/visual-interactivity#use-the-context-menu) for that area of the visual displays:

   <img src="https://mintcdn.com/insightsoftware/1fCfZrK84x8KmAw8/simba-embedded-analytics/docs/self-service-analytics/26.3/images/menus/context-menu-filter-22-4.png?fit=max&auto=format&n=1fCfZrK84x8KmAw8&q=85&s=35ba654be0f8692f33e03dea9e98c572" alt="Select to filter your data" width="158" height="188" data-path="simba-embedded-analytics/docs/self-service-analytics/26.3/images/menus/context-menu-filter-22-4.png" />

   <Note>
     Filters for cross-source and same-source links must be defined using the [context menu](/simba-embedded-analytics/docs/self-service-analytics/26.3/analyze-data/visuals/visual-interactivity#use-the-context-menu). You cannot create a link filter from the [Filters sidebar](/simba-embedded-analytics/docs/self-service-analytics/26.3/analyze-data/filters/filters#the-filters-sidebar). Filters created from the sidebar apply only to the selected visual. Filters for cross-source and same-source links are called *cross-visual filters* and are listed in the [Filters sidebar](/simba-embedded-analytics/docs/self-service-analytics/26.3/analyze-data/filters/filters#the-filters-sidebar) separately from filters that are applied from the Filters sidebar.
   </Note>

2. Select **Filter** on the [context menu](/simba-embedded-analytics/docs/self-service-analytics/26.3/analyze-data/visuals/visual-interactivity#use-the-context-menu).

   The filter is automatically applied to all of the visuals that are subscribed to the link. For more information about published and subscribed links, see Control How Cross-Visual Filters Interact in a Dashboard.

3. [Save](/simba-embedded-analytics/docs/self-service-analytics/26.3/analyze-data/dashboards/dash-manage#save-a-dashboard) the dashboard.

<h3 id="apply-cross-visual-filtering-from-the-time-bar">
  Apply Cross-Visual Filtering From the Time Bar
</h3>

To apply a cross-visual filter from the time bar, a same-source or cross-source link for time fields in the data sources must first be created.

**Apply a cross-visual filter to the dashboard using a time field from the time bar**

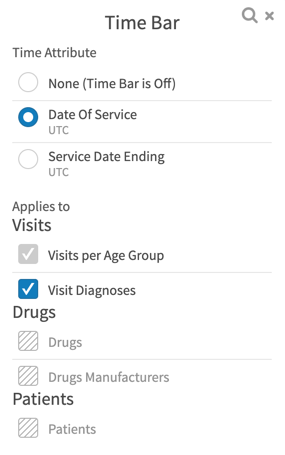
1. After cross-visual links are created, select the time field in the time bar. The Time Bar dialog appears.
   <img src="https://mintcdn.com/insightsoftware/GTXU--ZlYc3DodOR/simba-embedded-analytics/docs/self-service-analytics/26.3/images/dashboards/time-bar.png?fit=max&auto=format&n=GTXU--ZlYc3DodOR&q=85&s=08b9eeb97905486769b5e4923152a43d" alt="" width="285" height="455" data-path="simba-embedded-analytics/docs/self-service-analytics/26.3/images/dashboards/time-bar.png" />

2. Select the linked time field you have defined in the **Time Attribute** section of the Time Bar dialog.

3. Select the visuals to which you want the time filter applied in the **Applies to** section. The **Applies to** section lists all the visuals in the dashboard that use data from:

   * The same data source with a same-source link subscribed for the linked time field.
   * Different data sources with a linked time field for the data you have selected.

4. Adjust the time bar minimum or maximum to filter the visuals. See [Use the Time Bar](/simba-embedded-analytics/docs/self-service-analytics/26.3/analyze-data/time-bar).
