> ## Documentation Index
> Fetch the complete documentation index at: https://insightsoftware.mintlify.site/llms.txt
> Use this file to discover all available pages before exploring further.
# Even Time Intervals
> Even time intervals allow you to include all time groupings from your data source on a dashboard that have date or time data. You can select whether you want to display all time data, or just the data that returns a value. By default, time groups with a value of NULL (groups without any data) are not displayed.
Even time intervals allow you to include all time groupings from your data source on a dashboard that have date or time data. You can select whether you want to display all time data, or just the data that returns a value. If time groups include a NULL value, these values are included. Filter by row as needed:
* Apply `Is not NULL` to hide null values
* Apply `Is NULL` to include only null values
Even time interval grouping is only available on dashboards that use a data source with date and time fields. It is also not available for KPI charts or maps.
Even time intervals can be displayed in live mode and historical playback using the time bar. See [Live Mode and Historical Playback](/simba-embedded-analytics/docs/self-service-analytics/26.3/analyze-data/time-bar#live-mode-and-historical-playback).
See the following topics:
* [Apply Even Time Intervals on Most Visuals](#apply-even-time-intervals-on-most-visuals)
* [Apply Even Time Intervals on Pivot Tables](#apply-even-time-intervals-on-pivot-tables)
* [Apply Even Time Intervals on Tables](#apply-even-time-intervals-on-tables)
Apply Even Time Intervals on Most Visuals
For more information about even time intervals, see Even Time Intervals.
**Apply even time intervals to data on bar, box plot, donut, floating bubble, heat map, line, packed bubble, pie, scatter, tree map, and word cloud visuals**
1. [Edit](/simba-embedded-analytics/docs/self-service-analytics/26.3/analyze-data/dashboards/dash-manage#edit-a-dashboard) a dashboard with one of these visual types that uses a data source containing date or time fields.
2. Select a time attribute for the visual Group (x-axis).
3. Select the Time Granularity box on the x-axis.
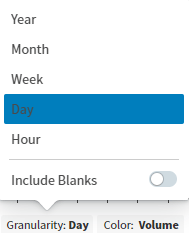 4. Slide **Include Blanks** on to request even time intervals. By default, the ability to show all values is disabled and only attributes with a value greater than NULL are displayed.
If this is a line chart, you can also select the **Display null as zero** checkbox to request that null values display as zeros on the chart:
4. Slide **Include Blanks** on to request even time intervals. By default, the ability to show all values is disabled and only attributes with a value greater than NULL are displayed.
If this is a line chart, you can also select the **Display null as zero** checkbox to request that null values display as zeros on the chart:
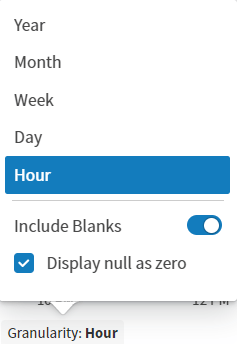 The dashboard updates to include all values from the data source.
Apply Even Time Intervals on Pivot Tables
For more information about even time intervals, see Even Time Intervals.
**Apply even time intervals to data on pivot tables**
1. [Edit](/simba-embedded-analytics/docs/self-service-analytics/26.3/analyze-data/dashboards/dash-manage#edit-a-dashboard) a dashboard with a pivot table that uses a data source containing date or time fields.
2. If you are editing the visual in a dashboard, select **Settings** from the [visual drop-down menu](/simba-embedded-analytics/docs/self-service-analytics/26.3/analyze-data/visuals/visual-setup#use-the-visual-drop-down-menu). The [sidebar menu](/simba-embedded-analytics/docs/self-service-analytics/26.3/analyze-data/visuals/visual-setup#use-the-visual-sidebar-menu) for the visual appears.
If you are editing the visual from the Visual Gallery, the sidebar appears to the right of the visual.
3. Select settings  on the [sidebar menu](/simba-embedded-analytics/docs/self-service-analytics/26.3/analyze-data/visuals/visual-setup#use-the-visual-sidebar-menu). The Pivot Table Settings sidebar for the visual appears.
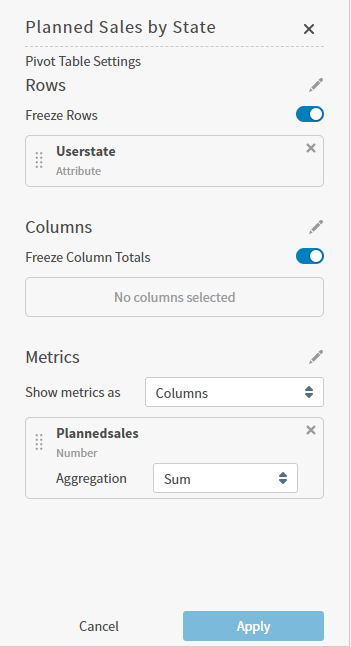 4. On the sidebar, select edit
  in **Rows** or **Columns** and select a time field for the row or column. Select **OK**.
The time field is selected and expands so you can select its granularity and even time intervals setting.
in **Rows** or **Columns** and select a time field for the row or column. Select **OK**.
The time field is selected and expands so you can select its granularity and even time intervals setting.
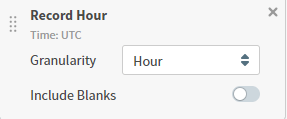 5. Select the granularity for the time field.
6. Slide **Include Blanks** on to request even time intervals. By default, the ability to show all values is disabled and only attributes with a value greater than NULL are displayed.
7. Select **Apply** to apply the changes to the pivot table.
8. Optionally, select Filter to include a Null filter on the Range tab as needed:
* Apply `Is not NULL` to hide null values
* Apply `Is NULL` to include only null values
5. Select the granularity for the time field.
6. Slide **Include Blanks** on to request even time intervals. By default, the ability to show all values is disabled and only attributes with a value greater than NULL are displayed.
7. Select **Apply** to apply the changes to the pivot table.
8. Optionally, select Filter to include a Null filter on the Range tab as needed:
* Apply `Is not NULL` to hide null values
* Apply `Is NULL` to include only null values
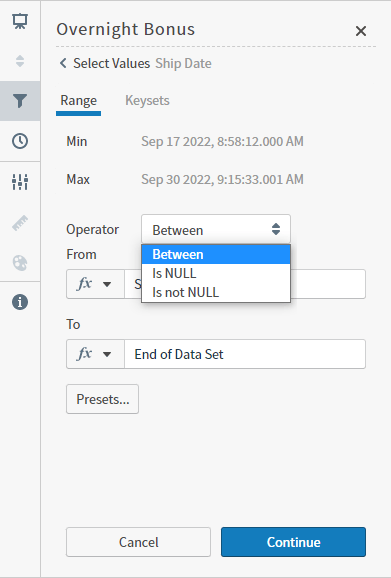 Select **Continue** to add the filter, then **Apply** to apply your changes to the pivot table.
Apply Even Time Intervals on Tables
If you group a table by a time field, you can select even time intervals for that time field. For more information about even time intervals, see Even Time Intervals.
**Apply even time intervals to a time field on a table from the table context menu**
1. [Edit](/simba-embedded-analytics/docs/self-service-analytics/26.3/analyze-data/dashboards/dash-manage#edit-a-dashboard) a dashboard with a table that uses a data source containing date or time fields.
2. Group the table by a time field in the data. See [Group and Ungroup Table Data](/simba-embedded-analytics/docs/self-service-analytics/26.3/analyze-data/visuals/rdt#group-and-ungroup-table-data).
3. Select  next to the time field column heading to access the table context menu.
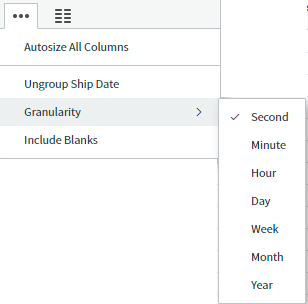 4. Select **Include Blanks** on the context menu. A check mark appears next to it.
Even time intervals are applied for the time field.
5. [Save](/simba-embedded-analytics/docs/self-service-analytics/26.3/analyze-data/dashboards/dash-manage#save-a-dashboard) the dashboard.
**Apply even time intervals to a time field using the sidebar menus**
1. [Edit](/simba-embedded-analytics/docs/self-service-analytics/26.3/analyze-data/dashboards/dash-manage#edit-a-dashboard) a dashboard with a table that uses a data source containing date or time fields. At least one field must be grouped.
2. If you are editing the visual in a dashboard, select **Settings** from the [visual drop-down menu](/simba-embedded-analytics/docs/self-service-analytics/26.3/analyze-data/visuals/visual-setup#use-the-visual-drop-down-menu). The [sidebar menu](/simba-embedded-analytics/docs/self-service-analytics/26.3/analyze-data/visuals/visual-setup#use-the-visual-sidebar-menu) for the visual appears.
If you are editing the visual from the Visual Gallery, the sidebar appears to the right of the visual.
3. Select settings on the [sidebar menu](/simba-embedded-analytics/docs/self-service-analytics/26.3/analyze-data/visuals/visual-setup#use-the-visual-sidebar-menu). The Table Settings sidebar for the visual appears.
4. Select **Include Blanks** on the context menu. A check mark appears next to it.
Even time intervals are applied for the time field.
5. [Save](/simba-embedded-analytics/docs/self-service-analytics/26.3/analyze-data/dashboards/dash-manage#save-a-dashboard) the dashboard.
**Apply even time intervals to a time field using the sidebar menus**
1. [Edit](/simba-embedded-analytics/docs/self-service-analytics/26.3/analyze-data/dashboards/dash-manage#edit-a-dashboard) a dashboard with a table that uses a data source containing date or time fields. At least one field must be grouped.
2. If you are editing the visual in a dashboard, select **Settings** from the [visual drop-down menu](/simba-embedded-analytics/docs/self-service-analytics/26.3/analyze-data/visuals/visual-setup#use-the-visual-drop-down-menu). The [sidebar menu](/simba-embedded-analytics/docs/self-service-analytics/26.3/analyze-data/visuals/visual-setup#use-the-visual-sidebar-menu) for the visual appears.
If you are editing the visual from the Visual Gallery, the sidebar appears to the right of the visual.
3. Select settings on the [sidebar menu](/simba-embedded-analytics/docs/self-service-analytics/26.3/analyze-data/visuals/visual-setup#use-the-visual-sidebar-menu). The Table Settings sidebar for the visual appears.
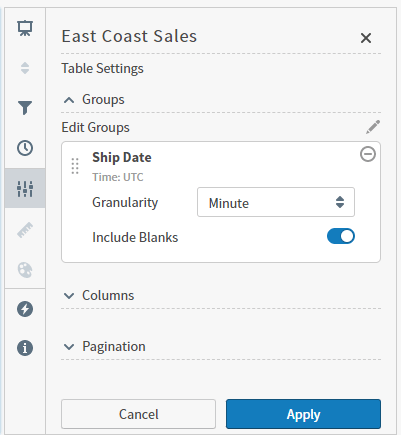 4. On the sidebar, select a time field in **Groups**.
The time field is selected and expands so you can select its granularity and even time intervals setting.
4. On the sidebar, select a time field in **Groups**.
The time field is selected and expands so you can select its granularity and even time intervals setting.
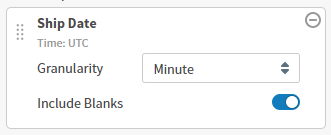 5. Select the granularity for the time field.
6. Slide **Include Blanks** on to request even time intervals. By default, the ability to show all values is disabled and only attributes with a value greater than NULL are displayed.
7. Select **Apply** to apply the changes to the table.
8. Optionally, select Filter to include a Null filter for this field on the Range tab as needed:
* Apply `Is not NULL` to hide null values
* Apply `Is NULL` to include only null values
5. Select the granularity for the time field.
6. Slide **Include Blanks** on to request even time intervals. By default, the ability to show all values is disabled and only attributes with a value greater than NULL are displayed.
7. Select **Apply** to apply the changes to the table.
8. Optionally, select Filter to include a Null filter for this field on the Range tab as needed:
* Apply `Is not NULL` to hide null values
* Apply `Is NULL` to include only null values
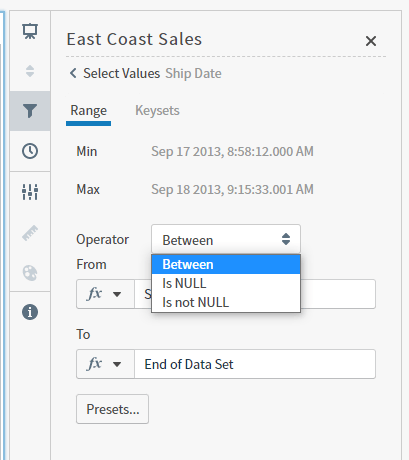 Select **Continue** to add the filter, then **Apply** to apply your changes to the table.