> ## Documentation Index
> Fetch the complete documentation index at: https://insightsoftware.mintlify.site/llms.txt
> Use this file to discover all available pages before exploring further.

# Dashboards

> Provides an overview of dashboard management tasks.

After you have successfully connected to your data stores and configured your data sources in Self-Service Analytics, you can immediately start exploring and interacting with the data using dashboards that contain visuals, rich text snippets, and filter snippets.

You have the flexibility to create a dashboard with a single visual or [rich text snippet](/simba-embedded-analytics/docs/self-service-analytics/26.3/analyze-data/widgets/rts-ov#add-rich-text-snippets-to-a-dashboard), and expand as needed. Quickly build, edit, and filter dashboards. Adjust the responsive layout to suit the varied needs of your users, and share dashboards directly with others or integrate within your web application.

Users who access your environment using a tablet or mobile device are presented with a responsive design and layout that resizes and adjusts to the available screen size. Touch actions provide intuitive access to dashboard functions: a short touch brings up the context menu, while a long touch surfaces tooltips and dashboard layout options. Task-based work areas, including menus and dashboard report scheduling, are sized appropriately for ease of use.

A dashboard is a collection of visuals from one or more data sources. You can add as many dashboards as you need. Increasing the number of visuals within a dashboard may impact its performance. Add [rich text snippets](/simba-embedded-analytics/docs/self-service-analytics/26.3/analyze-data/widgets/rts-ov#add-rich-text-snippets-to-a-dashboard) and [filter snippets](/simba-embedded-analytics/docs/self-service-analytics/26.3/analyze-data/widgets/fltrsnp-ov) to further present and refine the data you share with your users.

Before you begin, make sure that the data sources you want to use have been added and you have privileges to save visuals and dashboards.

* [Use the Library for Dashboards](#use-the-library-for-dashboards)
* [Create Dashboards](#create-dashboards)
* [Edit a Dashboard](#edit-a-dashboard)
* [Save a Dashboard](#save-a-dashboard)
* [List Dashboards](#list-dashboards)
* [Copy a Dashboard](#copy-a-dashboard)
* [Rename a Dashboard](#rename-a-dashboard)
* [Filter Data](/simba-embedded-analytics/docs/self-service-analytics/26.3/analyze-data/filters/filters)
* [Link a Dashboard](/simba-embedded-analytics/docs/self-service-analytics/26.3/analyze-data/dashboards/dash-interactivity#link-a-dashboard)
* [Dashboard Layouts](/simba-embedded-analytics/docs/self-service-analytics/26.3/analyze-data/dashboards/dash-layout)
* [Move, Swap, and Resize Visuals and Widgets in a Dashboard](/simba-embedded-analytics/docs/self-service-analytics/26.3/analyze-data/dashboards/dash-layout#move-swap-and-resize-visuals-and-widgets-in-a-dashboard)
* [Lock and Unlock Widget Positions](/simba-embedded-analytics/docs/self-service-analytics/26.3/analyze-data/dashboards/dash-layout#lock-and-unlock-widget-positions)
* [Use the Responsive Dashboard Layout](/simba-embedded-analytics/docs/self-service-analytics/26.3/analyze-data/dashboards/dash-layout#use-the-responsive-dashboard-layout)
* [Use Dashboard View Mode](/simba-embedded-analytics/docs/self-service-analytics/26.3/analyze-data/dashboards/dash-layout#use-dashboard-view-mode)
* [Share a Dashboard or Self Service Report with Users](/simba-embedded-analytics/docs/self-service-analytics/26.3/analyze-data/dashboards/dash-share-withinacct)
* [About Scheduled Reports](/simba-embedded-analytics/docs/self-service-analytics/26.3/analyze-data/dashboards/dash-schedule)
* [About Dashboard and Self Service Report Permissions](/simba-embedded-analytics/docs/self-service-analytics/26.3/analyze-data/dashboards/dash-auth-permissions#about-dashboard-and-self-service-report-permissions)
* [Export Dashboards](/simba-embedded-analytics/docs/self-service-analytics/26.3/analyze-data/dashboards/dash-import#export-dashboards)
* [Import Dashboards](/simba-embedded-analytics/docs/self-service-analytics/26.3/analyze-data/dashboards/dash-import)
* [Delete a Dashboard](#delete-a-dashboard)

<Note>
  You can force Self-Service Analytics to bypass the visualization cache and query the underlying data source by selecting **Refresh All** from a dashboard menu.
</Note>

<h2 id="create-dashboards">
  Create Dashboards
</h2>

Dashboards allow you to collect, display, and [share](/simba-embedded-analytics/docs/self-service-analytics/26.3/analyze-data/dashboards/dash-share-withinacct) data and information with your users to analyze in a variety of ways. [Responsive dashboard layouts](/simba-embedded-analytics/docs/self-service-analytics/26.3/analyze-data/dashboards/dash-layout#use-the-responsive-dashboard-layout) make your data accessible to your users flexibly, accommodating different screen sizes and embedded presentation layouts.

* A dashboard is a collection of one or more visuals, filter snippets, and rich text snippets in individual widgets.

  * Visuals in a dashboard can include data form one or more data sources. For example, add visuals that use Solr, Impala, Elasticsearch, and a [fused data source](/simba-embedded-analytics/docs/self-service-analytics/26.3/connect-to-data/sources/data-fusion-overview) to provide a comprehensive view of information from these varied sources.
  * Dashboard filters allow your users to search on and highlight specific data temporarily.
  * Use [rich text snippets](/simba-embedded-analytics/docs/self-service-analytics/26.3/analyze-data/widgets/rts-ov) to provide context to your visual data using formatted text, links, images, and generated visual summary descriptions.
  * [Generate visual summary descriptions](/simba-embedded-analytics/docs/self-service-analytics/26.3/analyze-data/widgets/rts-ov#describe-visual-generate-visual-summary-description) for many visual types; add it to your dashboard in a rich text snippet.
  * Take advantage of the [responsive layout for dashboards](/simba-embedded-analytics/docs/self-service-analytics/26.3/analyze-data/dashboards/dash-layout#use-the-responsive-dashboard-layout). This makes it easy for you and users arrange and layout widgets as needed, flexible and optimized for multiple screen sizes, from large display boards to handy mobile devices.

* A visual is a single view of data source data.

  * [Local visuals](/simba-embedded-analytics/docs/self-service-analytics/26.3/analyze-data/visuals/visual-add-dash#add-local-visuals-to-a-dashboard) are unique to a dashboard; edit and adjust to test data and analysis difference approaches. Changes to local visuals do not affect other dashboards. [Convert](/simba-embedded-analytics/docs/self-service-analytics/26.3/analyze-data/visuals/visual-add-dash#convert-visual-gallery-visuals-and-local-visuals) to a Visual Gallery visual at any time.
  * Visual Gallery visuals are stored in the visual gallery. Any changes saved for these visuals are reflected in all dashboards that contain these visuals. [Convert](/simba-embedded-analytics/docs/self-service-analytics/26.3/analyze-data/visuals/visual-add-dash#convert-visual-gallery-visuals-and-local-visuals) to a local visual at any time.

* [Rich text snippets](/simba-embedded-analytics/docs/self-service-analytics/26.3/analyze-data/widgets/rts-ov#add-rich-text-snippets-to-a-dashboard) round out your user's data experience by describing your data in context in a dashboard. Use to link external resources, including images, and generated [visual summary descriptions for visuals](/simba-embedded-analytics/docs/self-service-analytics/26.3/analyze-data/widgets/rts-ov#describe-visual-generate-visual-summary-description).

* [A filter snippet](/simba-embedded-analytics/docs/self-service-analytics/26.3/analyze-data/widgets/fltrsnp-ov) is a series of links you build between visuals based on custom values and fields. Your users can use the filter to view connected data in multiple visuals quickly and easily.

When you create a new dashboard, you are prompted to add a new visual or an existing visual, but you can add a rich text snippet or simply save the dashboard and return to edit it later. The dashboard is saved in the [library](#use-the-library-for-dashboards).

<Note>
  In this release, when your admin enables the Enhanced Experience user interface, you will see changes to workflows you may have used in previous releases.
</Note>

**Create a dashboard with a visual, rich text snippet, or filter snippet**

1. Log in as an administrator or a user who has been assigned to a group with the [**Administer Dashboards** privilege](/simba-embedded-analytics/docs/self-service-analytics/26.3/administer/users/aaa-ov#group-privilege-reference) or **Create Dashboards** privilege.

2. Select the **Discovery Board** card on your home page or **Library** from the main menu. The dashboard library opens.

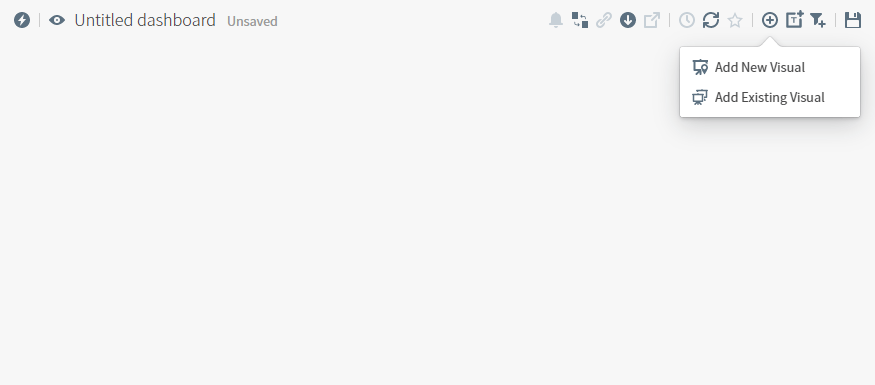
3. Select **Add Dashboard**. A blank dashboard appears showing your options. Add a new visual, place an existing visual, add a rich text snippet, or filter snippet.

   <img src="https://mintcdn.com/insightsoftware/2cXq_sDOxrDVXUcv/simba-embedded-analytics/docs/self-service-analytics/26.3/images/dashboards/dashboard-23-1.png?fit=max&auto=format&n=2cXq_sDOxrDVXUcv&q=85&s=07f0f36374e27cf07f0e328de4f92d7d" alt="define visuals, rich text snippets, and filter snippets for a dashboard" width="875" height="385" data-path="simba-embedded-analytics/docs/self-service-analytics/26.3/images/dashboards/dashboard-23-1.png" />

4. Select **Add New Visual** to add a new local visual to the dashboard. Select **Add Existing Visual** to add an existing visual from the visual gallery to the dashboard.

   * If you select **Add New Visual**, follow the procedure described in [Manage Visuals](/simba-embedded-analytics/docs/self-service-analytics/26.3/analyze-data/visuals/visual-add-dash)
   * If you select **Add Existing Visual**, follow the procedure described in [Add Existing Visuals to a Dashboard](/simba-embedded-analytics/docs/self-service-analytics/26.3/analyze-data/visuals/visual-add-dash#add-existing-visuals-to-a-dashboard).

5. Select <img src="https://mintcdn.com/insightsoftware/sLccJ1EJ28cO5lT_/simba-embedded-analytics/docs/self-service-analytics/26.3/images/icons/rts-add.png?fit=max&auto=format&n=sLccJ1EJ28cO5lT_&q=85&s=b69f086e70f0d10816d924ba9225dc95" alt="select to add a rich text snippet" width="28" height="28" noZoom style={{display: 'inline', verticalAlign: 'middle', width: '28px', height: '28px', margin: '0 2px'}} data-path="simba-embedded-analytics/docs/self-service-analytics/26.3/images/icons/rts-add.png" /> to add a rich text snippet to the dashboard. See [Add Rich Text Snippets to a Dashboard](/simba-embedded-analytics/docs/self-service-analytics/26.3/analyze-data/widgets/rts-ov#add-rich-text-snippets-to-a-dashboard).

6. Select <img src="https://mintcdn.com/insightsoftware/sLccJ1EJ28cO5lT_/simba-embedded-analytics/docs/self-service-analytics/26.3/images/icons/add-filter-snippet.png?fit=max&auto=format&n=sLccJ1EJ28cO5lT_&q=85&s=499601ef1705bb1d3ad3838d4b141b1a" alt="select the add filter snippet icon to add a filter snippet to a dashboard" width="20" height="19" noZoom data-path="simba-embedded-analytics/docs/self-service-analytics/26.3/images/icons/add-filter-snippet.png" /> to add a filter snippet to the dashboard. See [Add Filter Snippets to a Dashboard](/simba-embedded-analytics/docs/self-service-analytics/26.3/analyze-data/widgets/fltrsnp-ov#add-filter-snippets-to-a-dashboard).

7. [Save](#save-a-dashboard) your dashboard. Accept the default name, or supply a name for the dashboard.

   You can continue to add visuals and snippets. See [Manage Visuals](/simba-embedded-analytics/docs/self-service-analytics/26.3/analyze-data/visuals/visual-add-dash) and [Add Existing Visuals to a Dashboard](/simba-embedded-analytics/docs/self-service-analytics/26.3/analyze-data/visuals/visual-add-dash#add-existing-visuals-to-a-dashboard), [Add Rich Text Snippets to a Dashboard](/simba-embedded-analytics/docs/self-service-analytics/26.3/analyze-data/widgets/rts-ov#add-rich-text-snippets-to-a-dashboard), and [Add Filter Snippets to a Dashboard](/simba-embedded-analytics/docs/self-service-analytics/26.3/analyze-data/widgets/fltrsnp-ov#add-filter-snippets-to-a-dashboard).

After a dashboard is created, you can explore its data and work directly with its various visuals. You can modify, copy, export or delete its visuals. In addition, the data on the visual can be filtered (see [Filter Data](/simba-embedded-analytics/docs/self-service-analytics/26.3/analyze-data/filters/filters)). Finally, you can share, export, or delete the dashboard (see Dashboards).

<h2 id="edit-a-dashboard">
  Edit a Dashboard
</h2>

<Note>
  In this release, when your admin enables the Enhanced Experience user interface, you will see changes to workflows you may have used in previous releases.
</Note>

**Edit a dashboard**

1. Log in as an administrator or a user who has been assigned to a group with the [**Administer Dashboards** privilege](/simba-embedded-analytics/docs/self-service-analytics/26.3/administer/users/aaa-ov#group-privilege-reference).
2. Select the **Discovery Board** card on your home page or **Library** from the main menu. The dashboard library opens, with dashboards displayed in a table (list) format.
3. Select the dashboard in the list. The dashboard opens.
4. Adjust the dashboard, adding or removing widgets that contain visuals, rich text snippets, or filter snippets on the dashboard as needed.
5. [Save](#save-a-dashboard) your dashboard.

<h2 id="save-a-dashboard">
  Save a Dashboard
</h2>

When you create a new dashboard, you can save it with no content in the [library](#use-the-library-for-dashboards). You are prompted to add a new visual or an existing visual, but you can add a rich text snippet or simply save the dashboard and return to edit it later. The dashboard is saved in the [library](#use-the-library-for-dashboards).

When you attempt to save changes to a dashboard, Self-Service Analytics automatically saves any changes to:

* local visuals
* rich text snippets
* filter snippets
* added and repositioned shared visuals with no unsaved data changes

If your dashboard includes shared visual gallery visuals, Self-Service Analytics checks to for unsaved data changes to the visuals. If there are unsaved changes, you can elect to save each affected visual when you save the dashboard.

<Note>
  When you save a dashboard, only the last time bar field you were using and its range and playback configuration are saved.
</Note>

The following factors affect your ability to save a dashboard and its visuals.

* You must log in as an Owner or Editor of a dashboard, or have the **Create Dashboards** [privilege](/simba-embedded-analytics/docs/self-service-analytics/26.3/administer/users/aaa-ov#group-privilege-reference).
* Shared visual gallery visuals are saved if you have **Create Visuals** (or **Administer Visuals**) [privilege](/simba-embedded-analytics/docs/self-service-analytics/26.3/administer/users/aaa-ov#group-privilege-reference).
* The visuals on the dashboard will only be saved if write [permission](/simba-embedded-analytics/docs/self-service-analytics/26.3/analyze-data/visuals/visual-auth) for the visual has been granted to the user, one of the user's groups, or the user's Self-Service Analytics account. See [About Visual Permissions](/simba-embedded-analytics/docs/self-service-analytics/26.3/analyze-data/visuals/visual-auth).

**Save a dashboard**

1. In the dashboard header, select the Save icon (<img src="https://mintcdn.com/insightsoftware/2cXq_sDOxrDVXUcv/simba-embedded-analytics/docs/self-service-analytics/26.3/images/dashboards/dash-save.png?fit=max&auto=format&n=2cXq_sDOxrDVXUcv&q=85&s=c373f07d0546e540baff9fcabe9866af" alt="select the save icon to save your changes" width="21" height="20" noZoom style={{display: 'inline', verticalAlign: 'middle', width: '21px', height: '20px', margin: '0 2px'}} data-path="simba-embedded-analytics/docs/self-service-analytics/26.3/images/dashboards/dash-save.png" />) on the [dashboard icon bar](/simba-embedded-analytics/docs/self-service-analytics/26.3/analyze-data/dashboards/dash-layout#use-the-dashboard-icons). (The Save As (<img src="https://mintcdn.com/insightsoftware/GTXU--ZlYc3DodOR/simba-embedded-analytics/docs/self-service-analytics/26.3/images/dashboards/save-as.png?fit=max&auto=format&n=GTXU--ZlYc3DodOR&q=85&s=d812e74df4f8c2d8e318d41bc16f3d34" alt="select to save the item as a copy with a new name and your changes" width="20" height="21" noZoom data-path="simba-embedded-analytics/docs/self-service-analytics/26.3/images/dashboards/save-as.png" />) icon allows you to make a [copy](#copy-a-dashboard) of the dashboard.)

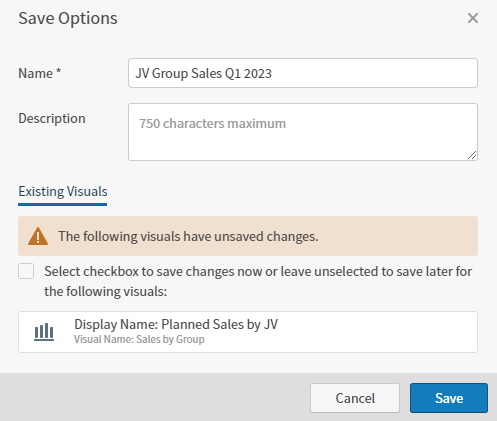
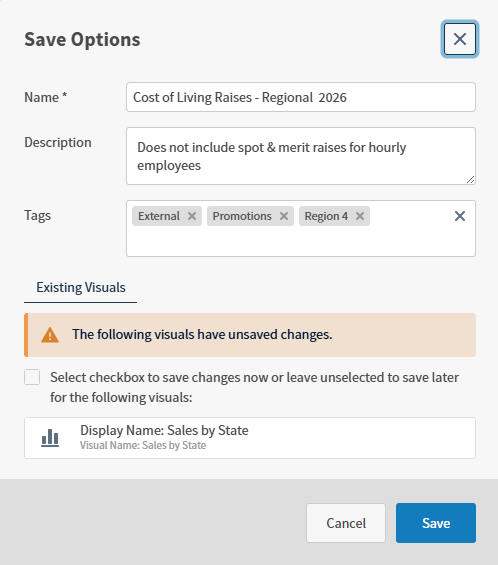
   The Save Options dialog appears.

   <img src="https://mintcdn.com/insightsoftware/GTXU--ZlYc3DodOR/simba-embedded-analytics/docs/self-service-analytics/26.3/images/dashboards/save-options-23-1.png?fit=max&auto=format&n=GTXU--ZlYc3DodOR&q=85&s=46c68025d4d0b4a10e6a00b6a5f96e45" alt="determine save options for your dashboard and unsaved visuals" width="497" height="421" data-path="simba-embedded-analytics/docs/self-service-analytics/26.3/images/dashboards/save-options-23-1.png" />

2. In the **Name** box, enter a title for your dashboard. This is the name by which the dashboard will be saved.

   * If you want to save the dashboard using a different name, change it here. The original dashboard is renamed. See [Rename a Dashboard](#rename-a-dashboard)
   * If you want to make a copy of a dashboard using a different name, see [Copy a Dashboard](#copy-a-dashboard).

3. If you want to provide details about your dashboard, do this in the **Description** box. A maximum of 750 characters can be specified. Leading and trailing spaces are not allowed.

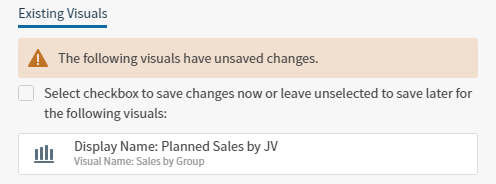
4. Review the list of shared visuals with unsaved changes on the **Existing Visuals** tab, if there are any.

   <img src="https://mintcdn.com/insightsoftware/GTXU--ZlYc3DodOR/simba-embedded-analytics/docs/self-service-analytics/26.3/images/dashboards/unsaved-visual-changes-23-1.png?fit=max&auto=format&n=GTXU--ZlYc3DodOR&q=85&s=4fb754d4b416de77d09a4ba8bda35970" alt="select the check box to save changes to unsaved visuals with changes" width="496" height="184" data-path="simba-embedded-analytics/docs/self-service-analytics/26.3/images/dashboards/unsaved-visual-changes-23-1.png" />

   Select the checkbox on this tab to save the changes to the visuals. Leave the checkbox cleared if you do not want to save the changes to the existing visuals. When you save them, the visuals are changed on every dashboard on which they are used. If you do not save the visuals, your changes will be discarded when you close the dashboard (a warning dialog displays first).

5. Select **Save** to save the dashboard or **Cancel** to cancel.

<h2 id="copy-a-dashboard">
  Copy a Dashboard
</h2>

You can make a copy of an existing dashboard by saving it with a new name. Depending on the visuals and their state of changes in the dashboard, Self-Service Analytics may prompt you to make decisions other than a new name for the copy of your dashboard.

<table>
  <thead>
    <tr>
      <th>Dashboard Contains</th>
      <th>Save As Options</th>
    </tr>
  </thead>

  <tbody>
    <tr>
      <td>Local Visuals</td>

      <td>
        * Provide a unique Name and optional Description for the new dashboard.
      </td>
    </tr>

    <tr>
      <td>Local Visuals and Visual Gallery Visuals (no unsaved visuals)</td>

      <td>
        * Provide a unique Name and optional Description for the new dashboard.
        * Optionally, convert all visual gallery visuals to local visuals.
      </td>
    </tr>

    <tr>
      <td>Local Visuals and Visual Gallery Visuals (visuals have unsaved changes)</td>

      <td>
        * Provide a unique Name and optional Description for the new dashboard.
        * Optionally, convert all visual gallery visuals to local visuals. Unsaved changes are applied to the local visuals in the new copy of the dashboard.

        <br />

        <Note>
          If you do not convert visual gallery visuals to local visuals Self-Service Analytics creates a copy of the dashboard using the saved versions of visual gallery visuals.
        </Note>
      </td>
    </tr>
  </tbody>
</table>

The following factors affect a user's ability to copy a dashboard and its visuals.

* The visuals on the dashboard are only saved if write [permission](/simba-embedded-analytics/docs/self-service-analytics/26.3/analyze-data/visuals/visual-auth) for the visual has been granted to the user, one of the user's groups, or the user's Self-Service Analytics account. See [About Visual Permissions](/simba-embedded-analytics/docs/self-service-analytics/26.3/analyze-data/visuals/visual-auth).

**Copy a dashboard**

1. In the dashboard header, select Save As icon on the [dashboard icon bar](/simba-embedded-analytics/docs/self-service-analytics/26.3/analyze-data/dashboards/dash-layout#use-the-dashboard-icons). (The Save icon allows you to [save](#save-a-dashboard) the dashboard.)

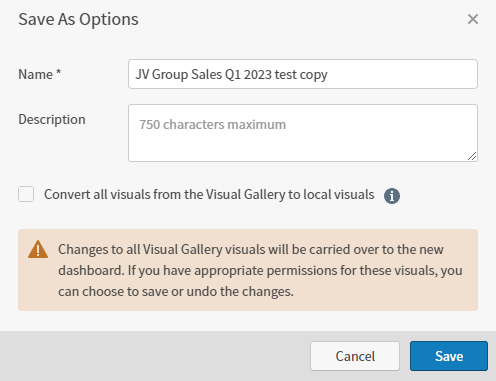
   The Save As Options dialog appears.

   <img src="https://mintcdn.com/insightsoftware/2cXq_sDOxrDVXUcv/simba-embedded-analytics/docs/self-service-analytics/26.3/images/dashboards/dash-save-as-work-area-23-1.png?fit=max&auto=format&n=2cXq_sDOxrDVXUcv&q=85&s=83d639754dc3843631b7818443e0ebd8" alt="select save as options using this work area" width="496" height="381" data-path="simba-embedded-analytics/docs/self-service-analytics/26.3/images/dashboards/dash-save-as-work-area-23-1.png" />

2. In the **Name** box, enter a new name for your dashboard. Self-Service Analytics returns an error when you select **Save** if you do not enter a new name.

3. If you want to provide details about your dashboard, do this in the **Description** box. A maximum of 255 characters can be specified. Leading and trailing spaces are not allowed.

4. Use the checkbox to indicate whether you also want to convert all visual gallery visuals into local visuals.

   * If you select this option, all shared visual gallery visuals are converted into local visuals in the copied dashboard.
   * If you do not select this option, Self-Service Analytics creates a copy of the dashboard using the saved versions of visual gallery visuals.

5. Select **Save** to create the newly named copy the dashboard in the library.

<h2 id="rename-a-dashboard">
  Rename a Dashboard
</h2>

When you create a dashboard, it is assigned a default name. You can change the name of your dashboard any time. You can rename it at the top of the dashboard or rename it when you save it.

<Note>
  You can also copy a dashboard and save the copy with a new name. See [Copy a Dashboard](#copy-a-dashboard).
</Note>

<Note>
  In this release, when your admin enables the Enhanced Experience user interface, you will see changes to workflows you may have used in previous releases.
</Note>

**Rename a dashboard at the top of the dashboard**

1. Select the **Discovery Board** card on your home page or **Library** from the main menu. The dashboard library opens.
2. [Edit](#edit-a-dashboard) the dashboard you want to rename.
3. Select the name of the dashboard at the top of the dashboard.
4. Specify the **new** name for your dashboard.
5. [Save](#save-a-dashboard) the dashboard.

**Rename a dashboard when you save it**

1. Select the **Discovery Board** card on your home page or **Library** from the main menu. The dashboard library opens.

2. [Edit](#edit-a-dashboard) the dashboard you want to rename.

3. In the dashboard header, select <img src="https://mintcdn.com/insightsoftware/2cXq_sDOxrDVXUcv/simba-embedded-analytics/docs/self-service-analytics/26.3/images/dashboards/dash-save.png?fit=max&auto=format&n=2cXq_sDOxrDVXUcv&q=85&s=c373f07d0546e540baff9fcabe9866af" alt="select the save icon to save your changes" width="21" height="20" noZoom style={{display: 'inline', verticalAlign: 'middle', width: '21px', height: '20px', margin: '0 2px'}} data-path="simba-embedded-analytics/docs/self-service-analytics/26.3/images/dashboards/dash-save.png" /> in the upper right corner of the dashboard.

   The Save Options dialog appears.

   <img src="https://mintcdn.com/insightsoftware/1fCfZrK84x8KmAw8/simba-embedded-analytics/docs/self-service-analytics/26.3/images/v26/work-areas/dashboards/save-opt-w-viz-263.png?fit=max&auto=format&n=1fCfZrK84x8KmAw8&q=85&s=7125092cbb0507a36c1beb5ff83bea27" alt="save options dialog for existing visuals" width="498" height="565" data-path="simba-embedded-analytics/docs/self-service-analytics/26.3/images/v26/work-areas/dashboards/save-opt-w-viz-263.png" />

4. In the Name box, specify the new name for your dashboard.

5. Optionally modify the description of the dashboard in the **Description** field. A maximum of 750 characters can be specified. Leading and trailing spaces are not allowed.

6. Select **Save** to save the dashboard.

<h2 id="delete-a-dashboard">
  Delete a Dashboard
</h2>

You can delete a dashboard from the library or from the dashboard itself.

<Note>
  The delete option is only available to the dashboard creator and the Self-Service Analytics administrator.
</Note>

If you delete a dashboard that has been shared with another user, it is deleted for all users.

You cannot delete a linked dashboard. If any other visual is linked to the dashboard, you must first remove the link from the visual or delete the visual's source dashboard.

<Note>
  If you try to delete a visual, filter snippet, dashboard, self service report, dashboard link, source, or source field, Self-Service Analytics displays an error message naming any objects dependent on the item you’re trying to delete. You can delete the item after you’ve removed the association from the dependent object. See [Fields Usage](/simba-embedded-analytics/docs/self-service-analytics/26.3/connect-to-data/sources/data-source-config-fields-tab#fields-usage).
</Note>

**Delete a dashboard from the library**

<Note>
  In this release, when your admin enables the Enhanced Experience user interface, you will see changes to workflows you may have used in previous releases.
</Note>

1. Log in as an administrator or a user who has been assigned to a group with the [**Administer Dashboards** privilege](/simba-embedded-analytics/docs/self-service-analytics/26.3/administer/users/aaa-ov#group-privilege-reference).
2. Select the **Discovery Board** card on your home page or **Library** from the main menu. The dashboard library opens.
3. Locate the dashboard you want to delete.
4. Select delete icon in the **Actions** column.
5. Confirm by selecting the **Delete** button on the warning dialog.

**Delete a dashboard from the dashboard itself**

1. [Edit](#edit-a-dashboard) the dashboard.
2. Select delete icon from the [dashboard icon bar](/simba-embedded-analytics/docs/self-service-analytics/26.3/analyze-data/dashboards/dash-layout#use-the-dashboard-icons).
3. Confirm by selecting the **Delete** button.

<h2 id="list-dashboards">
  List Dashboards
</h2>

<Note>
  In this release, when your admin enables the Enhanced Experience user interface, you will see changes to workflows you may have used in previous releases.
</Note>

**List the dashboards in a Self-Service Analytics** **instance**

1. Log into Self-Service Analytics as an administrator or a user who has been assigned to a group with the [**Administer Dashboards** privilege](/simba-embedded-analytics/docs/self-service-analytics/26.3/administer/users/aaa-ov#group-privilege-reference).
2. Select the **Discovery Board** card on your home page or **Library** from the main menu. The dashboard library opens.

<h2 id="use-the-library-for-dashboards">
  Use the Library for Dashboards
</h2>

The work area of the dashboards tab in library contains all dashboards in your environment to which you have access. You can make a dashboard a favorite, delete it (if your [privileges](/simba-embedded-analytics/docs/self-service-analytics/26.3/administer/users/aaa-ov#group-privilege-reference) allow), and open the dashboard.

If you have not been given access to dashboards, you will see no dashboards in the dashboards tab in library and you will not be able to import any dashboards. You will be able to create dashboards, but you will not be able to save them. Contact your system administrator to increase your [privileges](/simba-embedded-analytics/docs/self-service-analytics/26.3/administer/users/aaa-ov#group-privilege-reference).

<Note>
  In this release, when your admin enables the Enhanced Experience user interface, you will see changes to workflows you may have used in previous releases.
</Note>

### Access the Dashboard Library

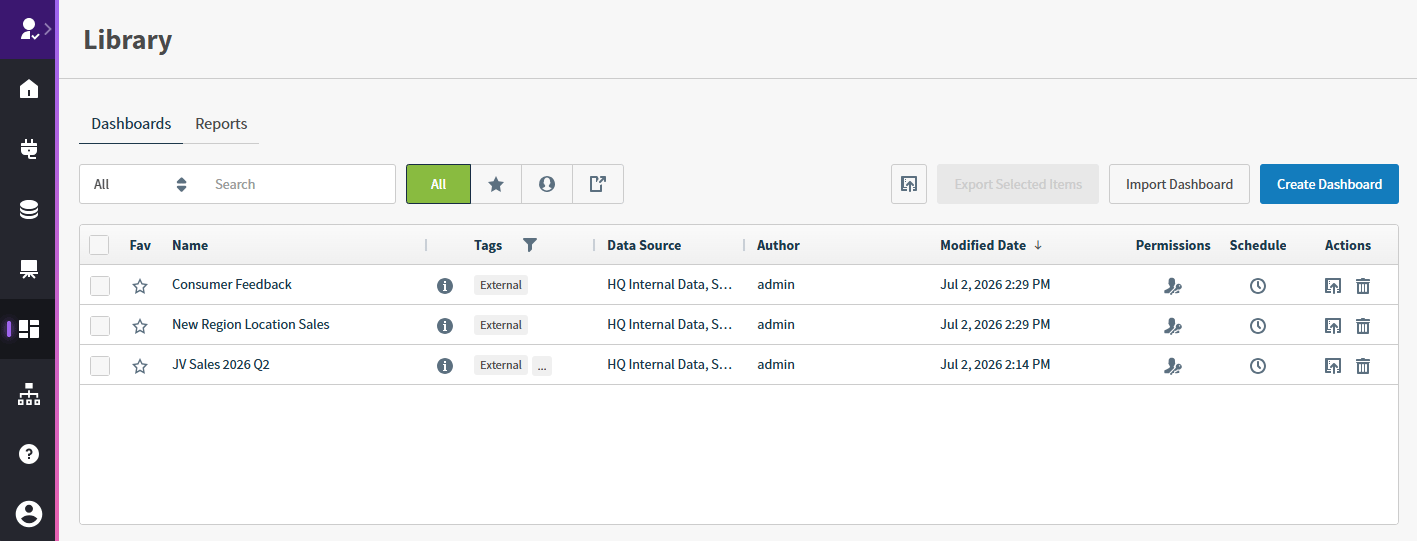
To access the library, select the **Discovery Board** card on your home page or **Library** from the main menu. The dashboard library opens, with dashboards displayed in a table (list) format.

<img src="https://mintcdn.com/insightsoftware/1fCfZrK84x8KmAw8/simba-embedded-analytics/docs/self-service-analytics/26.3/images/v26/work-areas/dashboards/dash-lib-26-2.png?fit=max&auto=format&n=1fCfZrK84x8KmAw8&q=85&s=810bb5aec71b6976d9198168f687bd8f" alt="use to manage your dashboards" width="1417" height="541" data-path="simba-embedded-analytics/docs/self-service-analytics/26.3/images/v26/work-areas/dashboards/dash-lib-26-2.png" />

### Search Field

You can use the search field to filter the dashboards in this work area by dashboard Name, Description (if provided), Data Source, or Author. For example, if you type a **C** in the search box, only dashboards that include the letter *C* in the selected field searched are shown in the working area. See [Search and Filter Lists](/simba-embedded-analytics/docs/self-service-analytics/26.3/get-started/welcome#search-and-filter-lists).

### Buttons

The buttons on the page allow easy access to saved dashboards, as well as other dashboards created by other users in your Self-Service Analytics environment. They also allow you to create a new dashboard, filter the dashboards that are shown, import, or export dashboards.

<table>
  <thead>
    <tr>
      <th>Button</th>
      <th>Description</th>
    </tr>
  </thead>

  <tbody>
    <tr>
      <td>**All**</td>
      <td>Removes any filters for the dashboard library and displays all dashboards available to you within your environment.</td>
    </tr>

    <tr>
      <td>
        <img src="https://mintcdn.com/insightsoftware/2cXq_sDOxrDVXUcv/simba-embedded-analytics/docs/self-service-analytics/26.3/images/buttons/dash-favorites.png?fit=max&auto=format&n=2cXq_sDOxrDVXUcv&q=85&s=3f42e7b5a7ec088f144961fc4e0b8168" alt="" width="32" height="32" noZoom style={{display: 'inline', verticalAlign: 'middle', width: '32px', height: '32px', margin: '0 2px'}} data-path="simba-embedded-analytics/docs/self-service-analytics/26.3/images/buttons/dash-favorites.png" />
      </td>

      <td>Displays only the dashboards you have marked as favorites.</td>
    </tr>

    <tr>
      <td>
        <img src="https://mintcdn.com/insightsoftware/2cXq_sDOxrDVXUcv/simba-embedded-analytics/docs/self-service-analytics/26.3/images/buttons/dash-myitems.png?fit=max&auto=format&n=2cXq_sDOxrDVXUcv&q=85&s=75cdbc10c3bd2b5d2e24e0f566314a74" alt="" width="32" height="32" noZoom style={{display: 'inline', verticalAlign: 'middle', width: '32px', height: '32px', margin: '0 2px'}} data-path="simba-embedded-analytics/docs/self-service-analytics/26.3/images/buttons/dash-myitems.png" />
      </td>

      <td>Displays only dashboards you created and saved. Dashboards created and saved by other users are hidden.</td>
    </tr>

    <tr>
      <td>
        <img src="https://mintcdn.com/insightsoftware/2cXq_sDOxrDVXUcv/simba-embedded-analytics/docs/self-service-analytics/26.3/images/buttons/dash-shared.png?fit=max&auto=format&n=2cXq_sDOxrDVXUcv&q=85&s=acc922b30add9660f0e1a0c755601279" alt="" width="32" height="32" noZoom style={{display: 'inline', verticalAlign: 'middle', width: '32px', height: '32px', margin: '0 2px'}} data-path="simba-embedded-analytics/docs/self-service-analytics/26.3/images/buttons/dash-shared.png" />
      </td>

      <td>
        Displays only the dashboards other users shared with you.

        <br />

        See [Share a Dashboard or Self Service Report with Users](/simba-embedded-analytics/docs/self-service-analytics/26.3/analyze-data/dashboards/dash-share-withinacct).
      </td>
    </tr>

    <tr>
      <td>
        <img src="https://mintcdn.com/insightsoftware/sLccJ1EJ28cO5lT_/simba-embedded-analytics/docs/self-service-analytics/26.3/images/icons/dashboard-embed.png?fit=max&auto=format&n=sLccJ1EJ28cO5lT_&q=85&s=64e9abef187115e782e94be2349f4b08" alt="" width="33" height="33" noZoom style={{display: 'inline', verticalAlign: 'middle', width: '33px', height: '33px', margin: '0 2px'}} data-path="simba-embedded-analytics/docs/self-service-analytics/26.3/images/icons/dashboard-embed.png" />
      </td>

      <td>Select to generate an embeddable dashboard link.</td>
    </tr>

    <tr>
      <td>**Export Selected Items**</td>

      <td>
        Select to export multiple selected items.

        <br />

        See [Export multiple dashboards](/simba-embedded-analytics/docs/self-service-analytics/26.3/analyze-data/dashboards/dash-import#export-dashboards) .
      </td>
    </tr>

    <tr>
      <td>**Import Dashboard**</td>

      <td>
        Select to import one or more dashboards.

        <br />

        See [Import Dashboards](/simba-embedded-analytics/docs/self-service-analytics/26.3/analyze-data/dashboards/dash-import).
      </td>
    </tr>

    <tr>
      <td>**Create Dashboard**</td>

      <td>
        Select to create a new dashboard.

        <br />

        See [Create Dashboards](#create-dashboards).
      </td>
    </tr>
  </tbody>
</table>

### List of Dashboards

The columns for this list are described below. Several of these columns can be used to sort the contents of the list: select the column header to sort first to last and again to sort last to first. You can search for items by the contents of several columns. See [Search and Filter Lists](/simba-embedded-analytics/docs/self-service-analytics/26.3/get-started/welcome#search-and-filter-lists).

<table>
  <thead>
    <tr>
      <th>Column</th>
      <th>Description</th>
    </tr>
  </thead>

  <tbody>
    <tr>
      <td>Select (not labeled)</td>
      <td>Select or deselect one or more items to perform bulk actions, such as export, for your content.</td>
    </tr>

    <tr>
      <td>Fav</td>
      <td>Identifies favorite dashboards using a star icon. If the star is colored (<img src="https://mintcdn.com/insightsoftware/1fCfZrK84x8KmAw8/simba-embedded-analytics/docs/self-service-analytics/26.3/images/icons/star-filled.png?fit=max&auto=format&n=1fCfZrK84x8KmAw8&q=85&s=2ee76d6f85fbd0c028cac5946b824b24" alt="" width="16" height="19" noZoom style={{display: 'inline', verticalAlign: 'middle', width: '16px', height: '19px', margin: '0 2px'}} data-path="simba-embedded-analytics/docs/self-service-analytics/26.3/images/icons/star-filled.png" />), the dashboard is a favorite. If the star is empty (<img src="https://mintcdn.com/insightsoftware/1fCfZrK84x8KmAw8/simba-embedded-analytics/docs/self-service-analytics/26.3/images/icons/star-open.png?fit=max&auto=format&n=1fCfZrK84x8KmAw8&q=85&s=7e48cb6585e2fe8ca8a2c41ec3d77e7c" alt="" width="16" height="17" noZoom style={{display: 'inline', verticalAlign: 'middle', width: '16px', height: '17px', margin: '0 2px'}} data-path="simba-embedded-analytics/docs/self-service-analytics/26.3/images/icons/star-open.png" />), the dashboard is not a favorite. If you change the favorite status of a dashboard while viewing or editing it, that change is reflected here.</td>
    </tr>

    <tr>
      <td>Name</td>
      <td>The name of the dashboard.</td>
    </tr>

    <tr>
      <td>Description (not labeled)</td>
      <td>The description icon is visible if a description associated with a dashboard. You can search for a dashboard by the contents of this field.</td>
    </tr>

    <tr>
      <td>Tags</td>
      <td>Content tags applied to the dashboard. Select the filter icon to open a drop down list and select tags to filter your list or to [narrow your search results](/simba-embedded-analytics/docs/self-service-analytics/26.3/get-started/welcome#filter-lists-and-search-results-using-tags). If several tags are associated with an item, hover over the ellipsis to see all tags for this resource.</td>
    </tr>

    <tr>
      <td>Filter icon</td>
      <td>Select to filter the work area's contents by one or more content tags.</td>
    </tr>

    <tr>
      <td>Data Source</td>
      <td>The name of the data sources used by the dashboard.</td>
    </tr>

    <tr>
      <td>Author</td>
      <td>The user who created the dashboard, or is currently assigned as the Author of the dashboard.</td>
    </tr>

    <tr>
      <td>Modify Author (not labeled)</td>
      <td>Hover next to the Author name, select the edit icon, and select a different dashboard Author.</td>
    </tr>

    <tr>
      <td>Modified Date</td>
      <td>The date the dashboard was last modified.</td>
    </tr>

    <tr>
      <td>Permissions</td>

      <td>
        Select the permissions icon in this column to assign permissions to a dashboard. The Dashboard Permissions dialog appears.

        <br />

        See [About Dashboard and Self Service Report Permissions](/simba-embedded-analytics/docs/self-service-analytics/26.3/analyze-data/dashboards/dash-auth-permissions#about-dashboard-and-self-service-report-permissions).
      </td>
    </tr>

    <tr>
      <td>Schedule</td>

      <td>
        Select the clock icon in this column to create a scheduled dashboard report for the dashboard. The Scheduled Reports dialog appears.

        <br />

        See [About Scheduled Reports](/simba-embedded-analytics/docs/self-service-analytics/26.3/analyze-data/dashboards/dash-schedule).
      </td>
    </tr>

    <tr>
      <td>Actions</td>

      <td>
        Shows icons you can select to perform actions for the dashboard.

        <br />

        * Select the delete icon in this column to delete a dashboard. See [Delete a Dashboard](#delete-a-dashboard).
        * Select the code snippet icon to generate an embeddable code snippet for the dashboard. The Embed Code dialog appears. See [Embed Components Into Your Application](/simba-embedded-analytics/docs/self-service-analytics/26.3/embed-and-extend/embed/dash-embed/dash-embed).
      </td>
    </tr>
  </tbody>
</table>

<h2 id="refresh-data-on-a-dashboard">
  Refresh Data on a Dashboard
</h2>

You can refresh the data on a dashboard. This will obtain and display the latest data from every data source used by the visuals in your dashboard.

**Refresh the data on a dashboard**

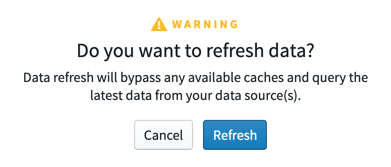
1. On the dashboard, select the refresh icon <img src="https://mintcdn.com/insightsoftware/2cXq_sDOxrDVXUcv/simba-embedded-analytics/docs/self-service-analytics/26.3/images/dashboards/dash-refresh.png?fit=max&auto=format&n=2cXq_sDOxrDVXUcv&q=85&s=53cc532b6fce4e41f7756425d1b87639" alt="select to refresh the underlying data behind an object, or the specific field" width="18" height="18" noZoom data-path="simba-embedded-analytics/docs/self-service-analytics/26.3/images/dashboards/dash-refresh.png" /> on the [dashboard icon bar](/simba-embedded-analytics/docs/self-service-analytics/26.3/analyze-data/dashboards/dash-layout#use-the-dashboard-icons). The Refresh dialog appears.
   <img src="https://mintcdn.com/insightsoftware/GTXU--ZlYc3DodOR/simba-embedded-analytics/docs/self-service-analytics/26.3/images/dashboards/refresh-dialog.png?fit=max&auto=format&n=GTXU--ZlYc3DodOR&q=85&s=6c1bb3ab91125a719f48c9c54fda6f8f" alt="" width="391" height="167" data-path="simba-embedded-analytics/docs/self-service-analytics/26.3/images/dashboards/refresh-dialog.png" />

2. Select **Refresh** on the dialog. All visuals on the dashboard are refreshed.

Even if the dashboard has not been saved, the refresh obtains the latest data and honors whatever unsaved changes you have made to it. For example, if you had applied a filter or added visuals to the dashboard, the filter and the new visuals are retained when the data is refreshed.

## Dashboard Smart Loading

Self-Service Analytics uses smart loading to load visuals on a dashboard. Smart loading improves the performance for loading visuals on a dashboard, especially for dashboards containing many visuals.

Without smart loading, visuals cannot be used until all the visuals in a dashboard are loaded. With smart loading, an initial maximum number of visuals are loaded simultaneously. The rest of the visuals are put on hold. After one or more initial visuals are loaded, other visuals in the dashboard are taken off hold and loaded, but only up to the set maximum. As visuals are loaded, they can be used immediately, without waiting for all the dashboard visuals to load.

Visuals are loaded from the top down. The immediately viewable visuals (the ones at the top of the dashboard) are loaded first, up to the set maximum. If you scroll down through a dashboard, a visual that is on hold and is placed farther from the top of the dashboard is started at a higher priority than other visuals on the dashboard.

For information on managing smart loading, including changing the maximum number of visuals that are loaded simultaneously (the default is eight visuals), contact insightsoftware [Technical Support](/simba-embedded-analytics/docs/self-service-analytics/26.3/get-started/tech-support).